Besides the Anaconda distribution of Python, NLTK and sqlalchemy libraries need to be installed. Use below commands to install these two libraries.
pip install nltk
pip install SQLAlchemy
pip install Flask
conda install -c plotly plotly
Then run the below command to download relevant nltk libraries:
nltk.download(['punkt', 'wordnet', 'averaged_perceptron_tagger','stopwords'])
After the installations, follow the below instruction using Python versions 3.*.
-
Run the following commands in the project's root directory to set up your database and model.
- To run ETL pipeline that cleans data and stores in a database
python data/process_data.py data/disaster_messages.csv data/disaster_categories.csv data/DisasterResponse.db - To run ML pipeline that trains classifier and saves
python models/train_classifier.py data/DisasterResponse.db models/classifier.pkl
- To run ETL pipeline that cleans data and stores in a database
-
Run the following command in the app's directory to run your web app.
python run.py -
Go to http://127.0.0.1:8080/
Alternatively, you can use the trained model available in the 'models' folder and skip step 1.
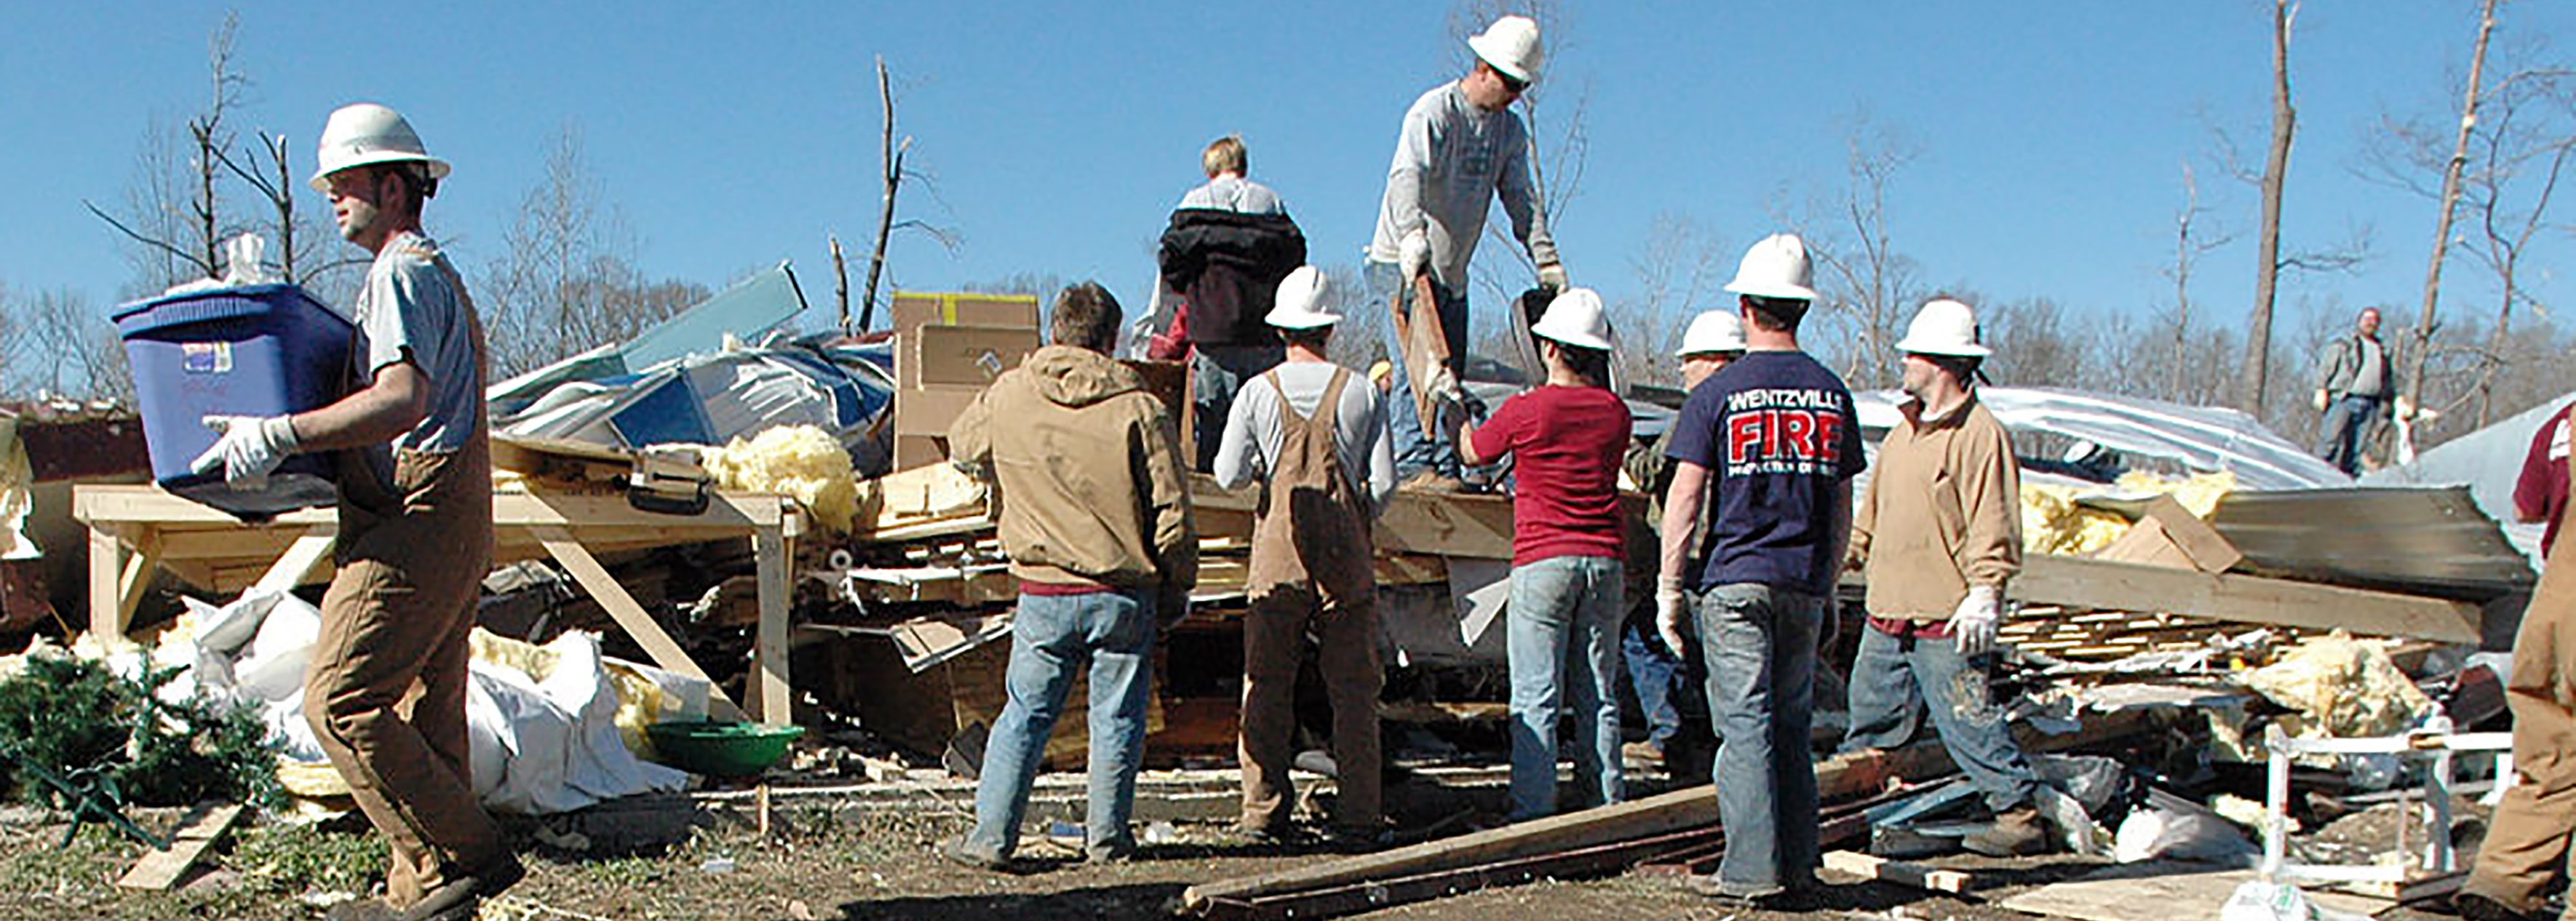
Typically, when there is a disaster, millions of messages reach disaster response organizations via direct or social media. The primary challenge then for these organizations becomes to filter out the relevant and most important messages with the limited resources they have. Also, for disaster response management, different organizations handle different relief operations. While some of them might take care of water-related problems, some others may cater to shelter or medical supplies. So, it is imperative to categorize the relevant messages further into different categories to achieve better efficiency in relief operations. Figure-eight compiled a data set containing real messages sent during disaster events and categorized them under 36 different categories. Our aim for this project is to use natural language processing techniques to process this data and then train a supervised machine learning algorithm to classify disaster messages to categories so we can appropriately handle different needs of the affected people. This project also includes a web app where an emergency worker can input a new message and get classification results in several categories.
Data:
- disaster_messages.csv: File containing 26248 messages from social media, news or direct sources.
- disaster_categories.csv: File containing the category labels of the disaster messages. A message can belong to multiple categories.
- process_data.py: This is basically an ETL pipeline, where we cleaned data and saved in a database.
- DisasterResponse.db: The output of process_data.py script. It's a database file where the script stores data.
Model:
- train_classifier.py: This is where we did the text processing using NLP techniques and then trained a machine learning pipeline on the data.
- classifier.pkl: The output of train_classifier.py script. It contains the trained model that can be used for making predictions.
App:
- run.py: Launches the web app which takes a message as an input and outputs the categories it belongs to.
- templates: Contains the code for rendering the app on a web page.
Images: Contains images used in this description file.
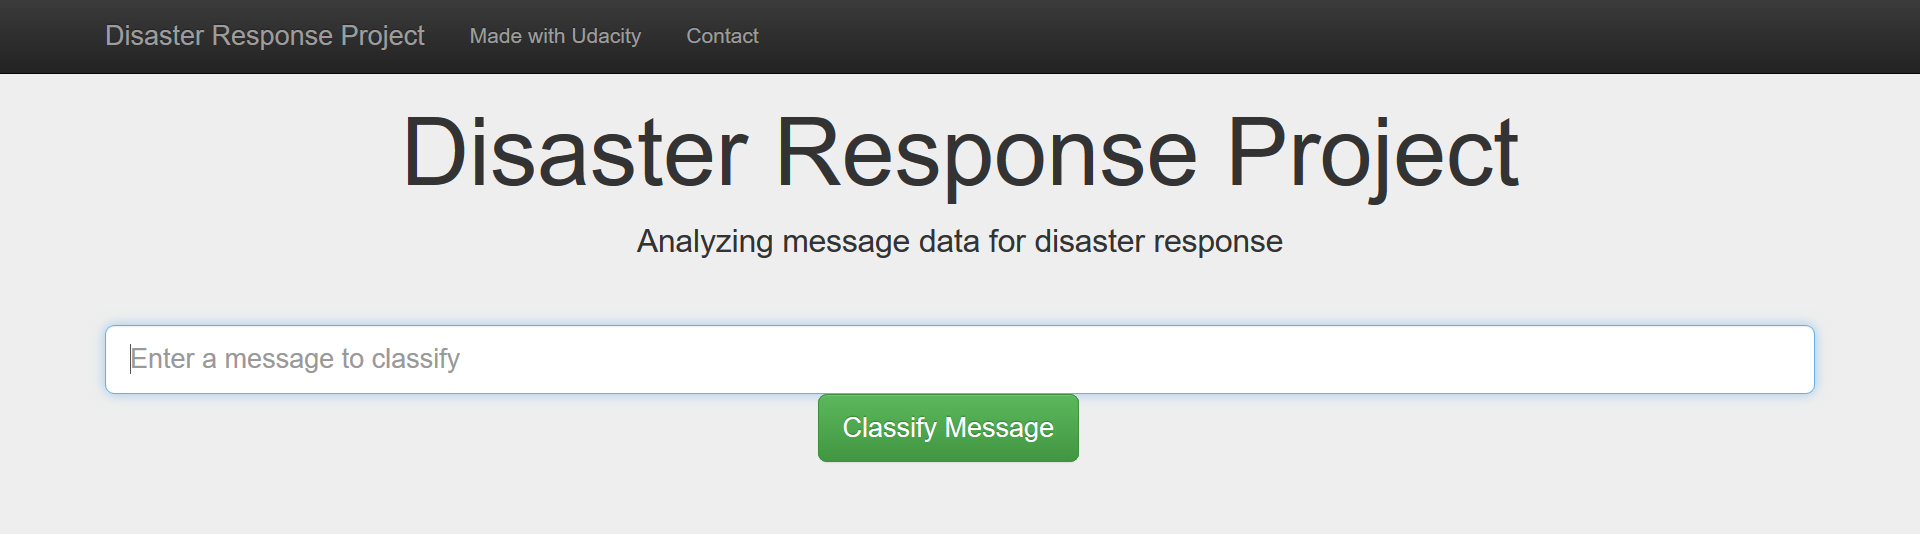
User interface for the Web-App:
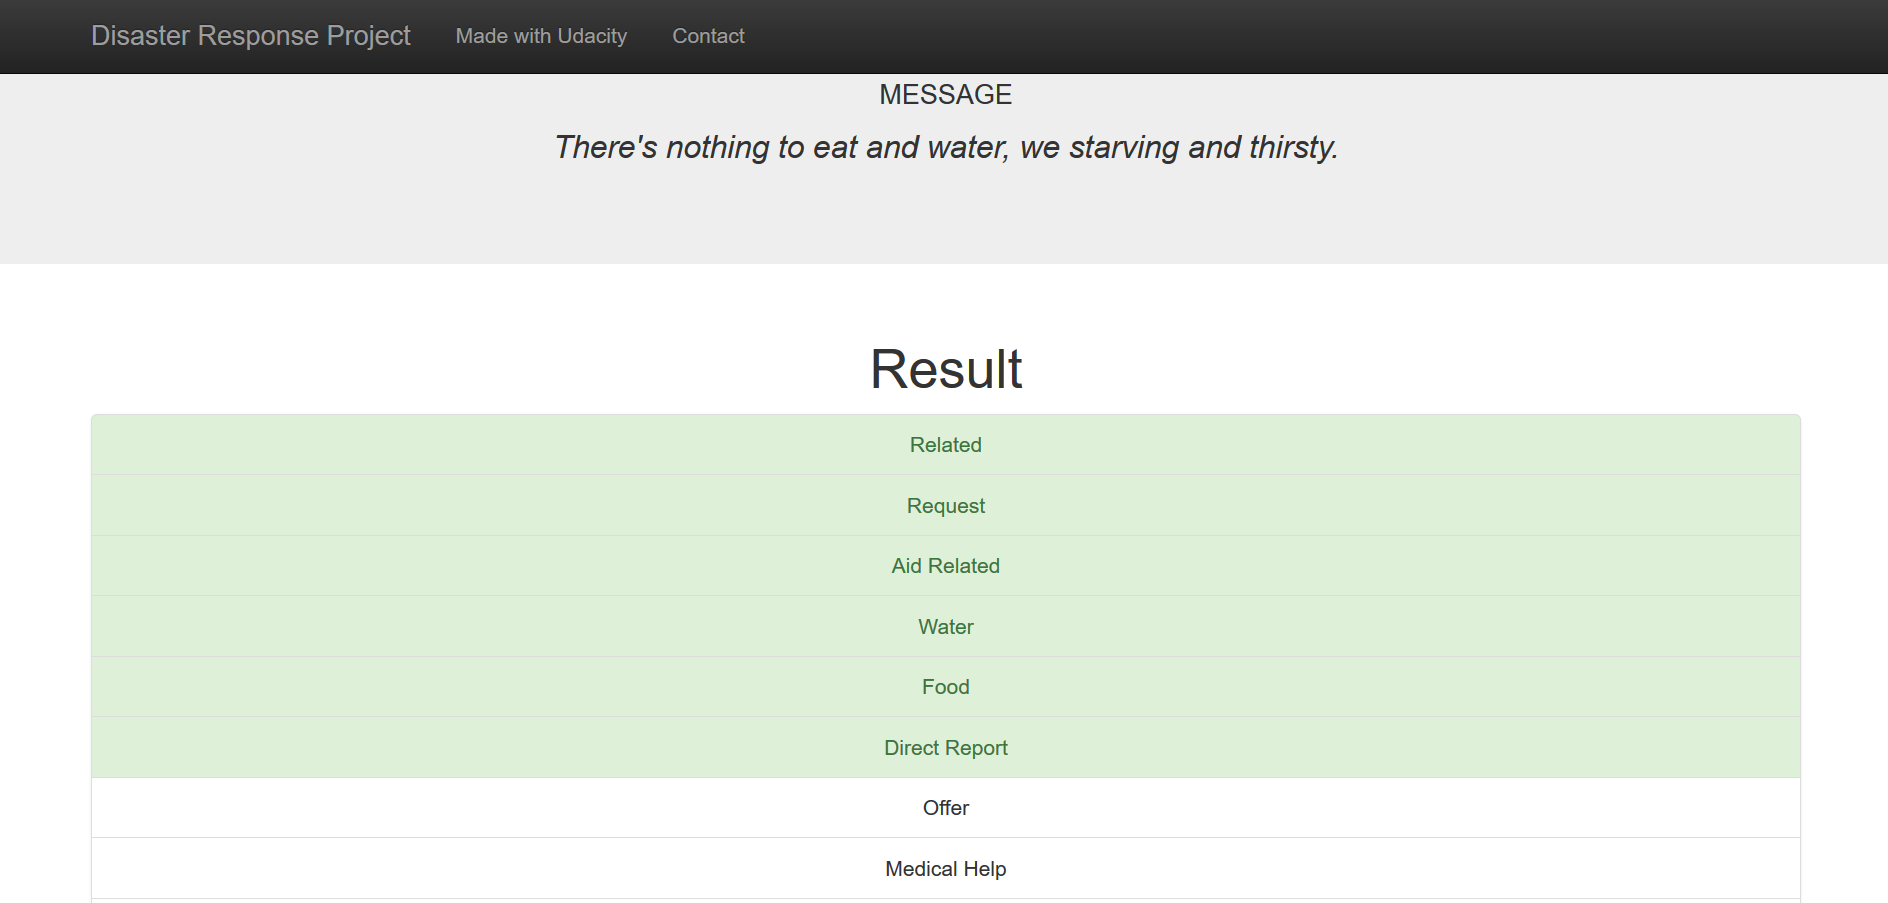
Sample message categorization:
Though the model generalized well for most of the categories, some categories like 'child alone','shops','offer' simply did not have enough data to train on. For instance, the 'child_alone' category did not even have a single positive sample. In class imbalance problems like this, the model usually develops a bias towards the majority classes and the 'accuracy' score does not reflect the true model performance. That's why we used 'f1_score', a weighted harmonic mean of precision and recall as the metric for our model evaluation. As a possible next step, we can explore various strategies to improve the model performance:
- Gathering more data
- Oversampling the minority and/or undersampling the majority class
- Generating synthetic data using algorithms like Synthetic Minority Over-sampling Technique.
This awesome article by Jason Brownlee discusses these strategies in more detail and can be used a reference.
Credits to Udacity and Figure Eight for coming up with the awesome project idea and compiling the dataset.