Code to easily create pixel-by-pixel plots of TESS full frame images, with options to plot the either a portion of the light curve or a periodogram of the data. This tool is helpful for visualizing whether the source of a signal originates from inside or outside of a predefined aperture, and thus useful for identifying sources of contamination. Currently, functionality is limited only to single sectors of data.
The core functions are stored in pbp_plot.py. See pbp_plot_demo.py for a short demonstration of how to use this code. Please direct questions to Rae Holcomb at rjholcom@uci.edu.
Package Requirements:
- numpy
- matplotlib
- lightkurve (Version 1.0.x, see: https://github.com/lightkurve/lightkurve)
download_tpf(target_name, sector=None)
-
Given the target name, i.e. 'TIC 233629963', 'TOI 1468', or 'LSPM J1835+3259', downloads the target pixel file for the first available sector. If sector keyword is specified (as an integer), that sector only will be retrieved. Multisector downloads are not currently supported.
-
Inputs:
- target_name - string
- sector - integer of which TESS sector you want
-
Outputs:
- tpf - a single sector lightkurve TargetPixelFile object
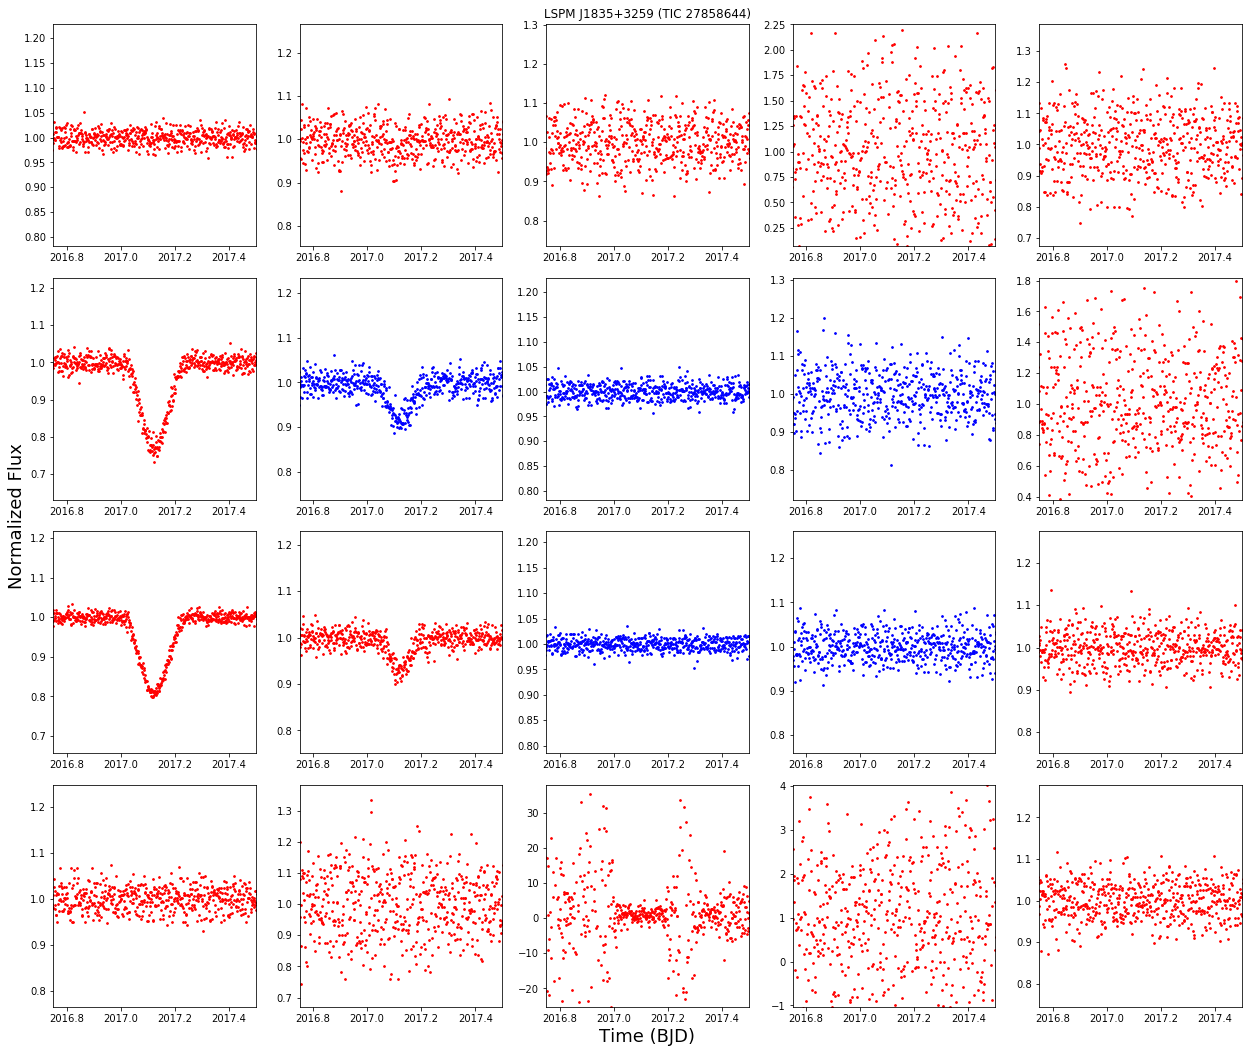
plot_pixel_by_pixel(target_name, tpf, plot_type='lc', padding=1, x_lim=None, y_lim=None, save=False, figname=None)
-
Creates a pixel-by-pixel plot of a tess target from the target pixel file. Subplots in blue are pixels inside the TESS pipeline aperture and those in red are outside it. Note that this code is best used for investigating signals of know duration or period, the plots are small so it is very helpful to know your x_lim before plotting. Note that this may run slowly, especially if a large aperture or padding is used.
-
Inputs:
- target_name - the name of the target to be plotted. Must be resolvable by the TIC.
- plot_type - either 'lc' or 'periodogram'. You may also create a custom function with a bit more work.
- padding - size of the pixel border around the TESS aperture you want to plot. Note that a large padding can result in slow runtime to generate plots.
- x_lim - for 'lc' the BJD dates you want plotted. For 'periodogram' the range of period in days.
- y_lim - the limits of the y-axis. If left blank with be scaled dynamically.
- save - Boolean of whether you would like the plots saved to a file or not.
-
Outputs:
- none