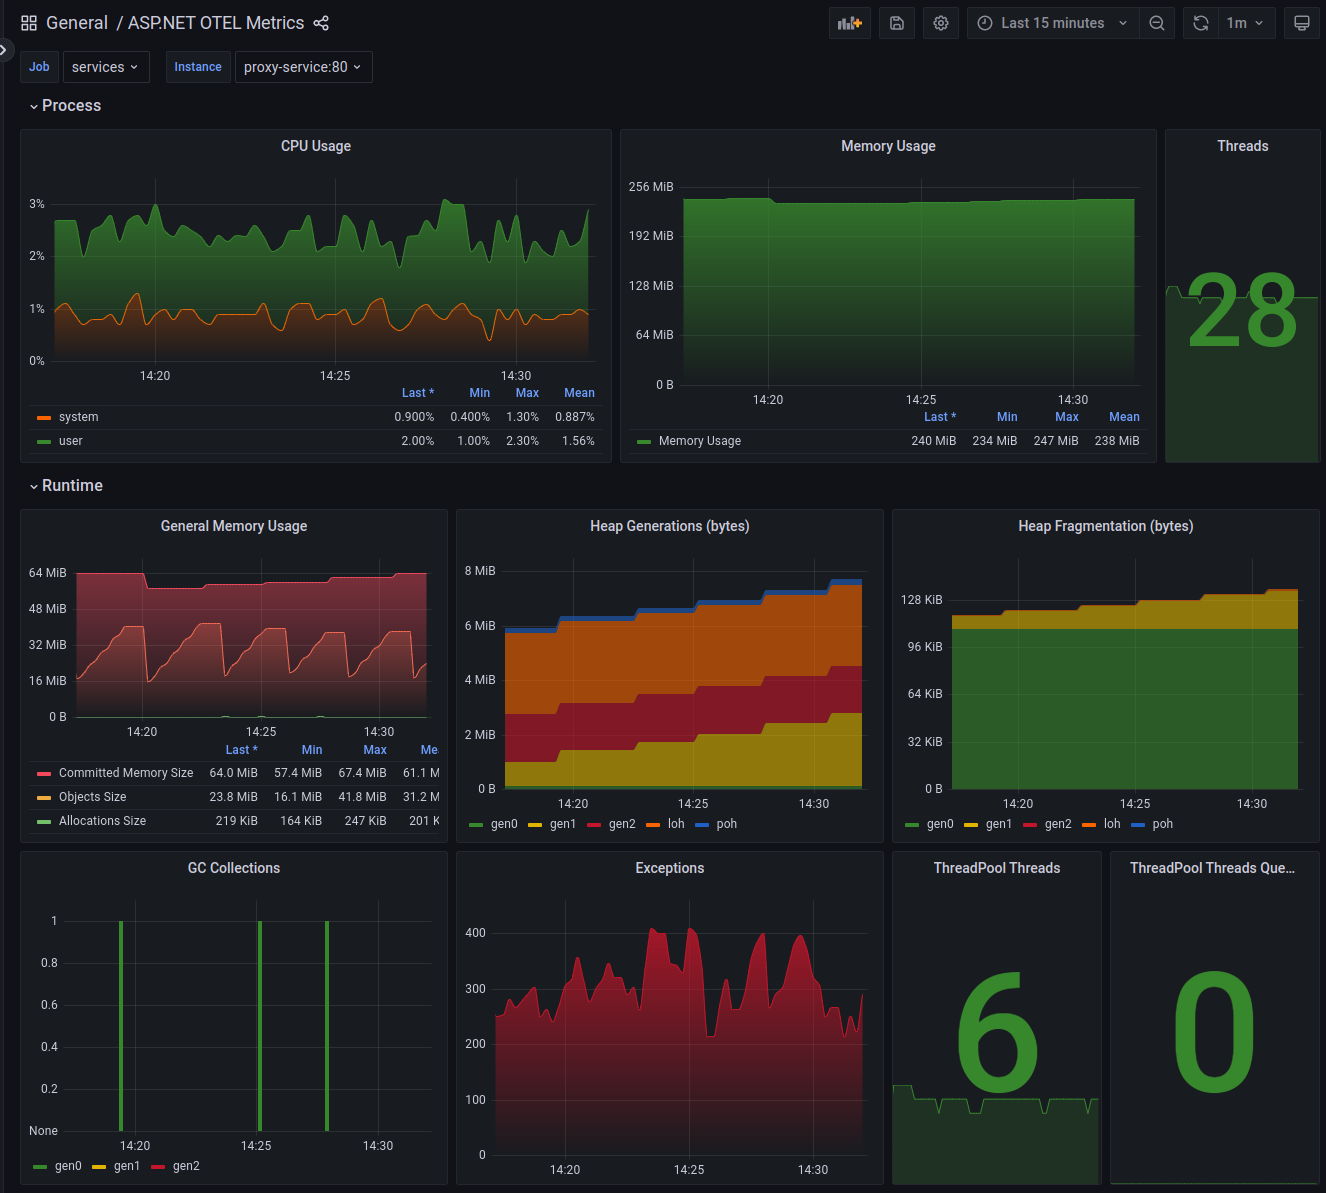
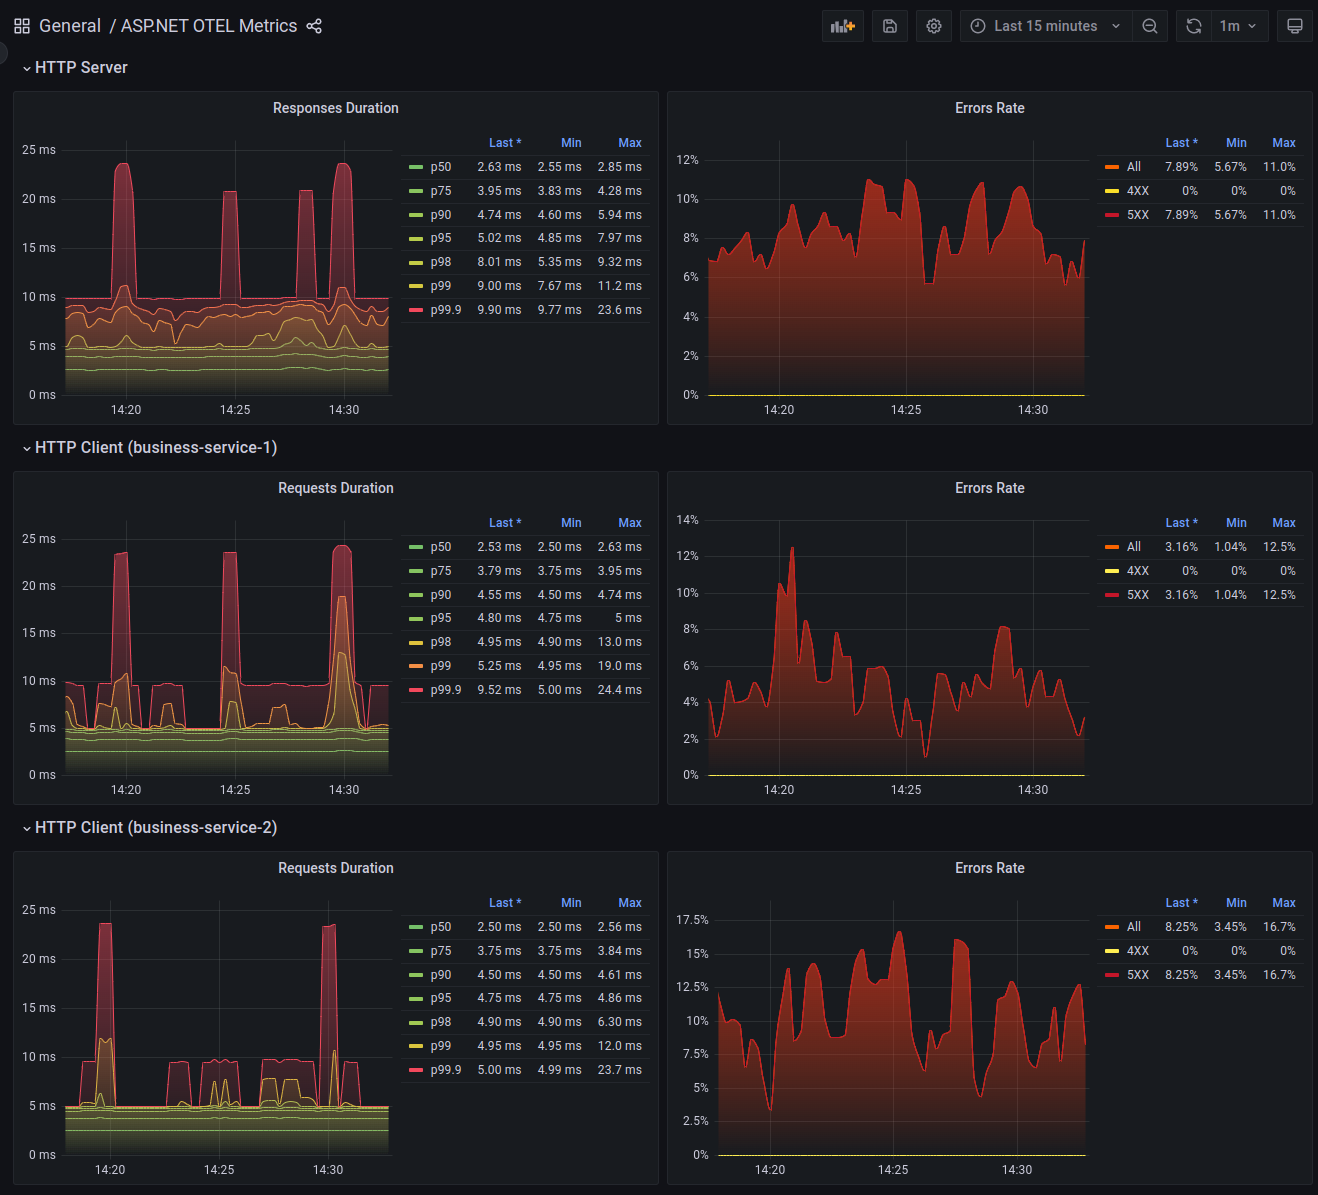
OpenTelemetry is a collection of tools, APIs, and SDKs to instrument, generate, collect, and export telemetry data (metrics, logs, and traces) to help you analyze your software’s performance and behavior.
Links:
There is a .NET SDK that helps to integrate .NET applications with OpenTelemetry:
- https://opentelemetry.io/docs/instrumentation/net/getting-started/
- https://github.com/open-telemetry/opentelemetry-dotnet
- https://www.nuget.org/packages/OpenTelemetry/
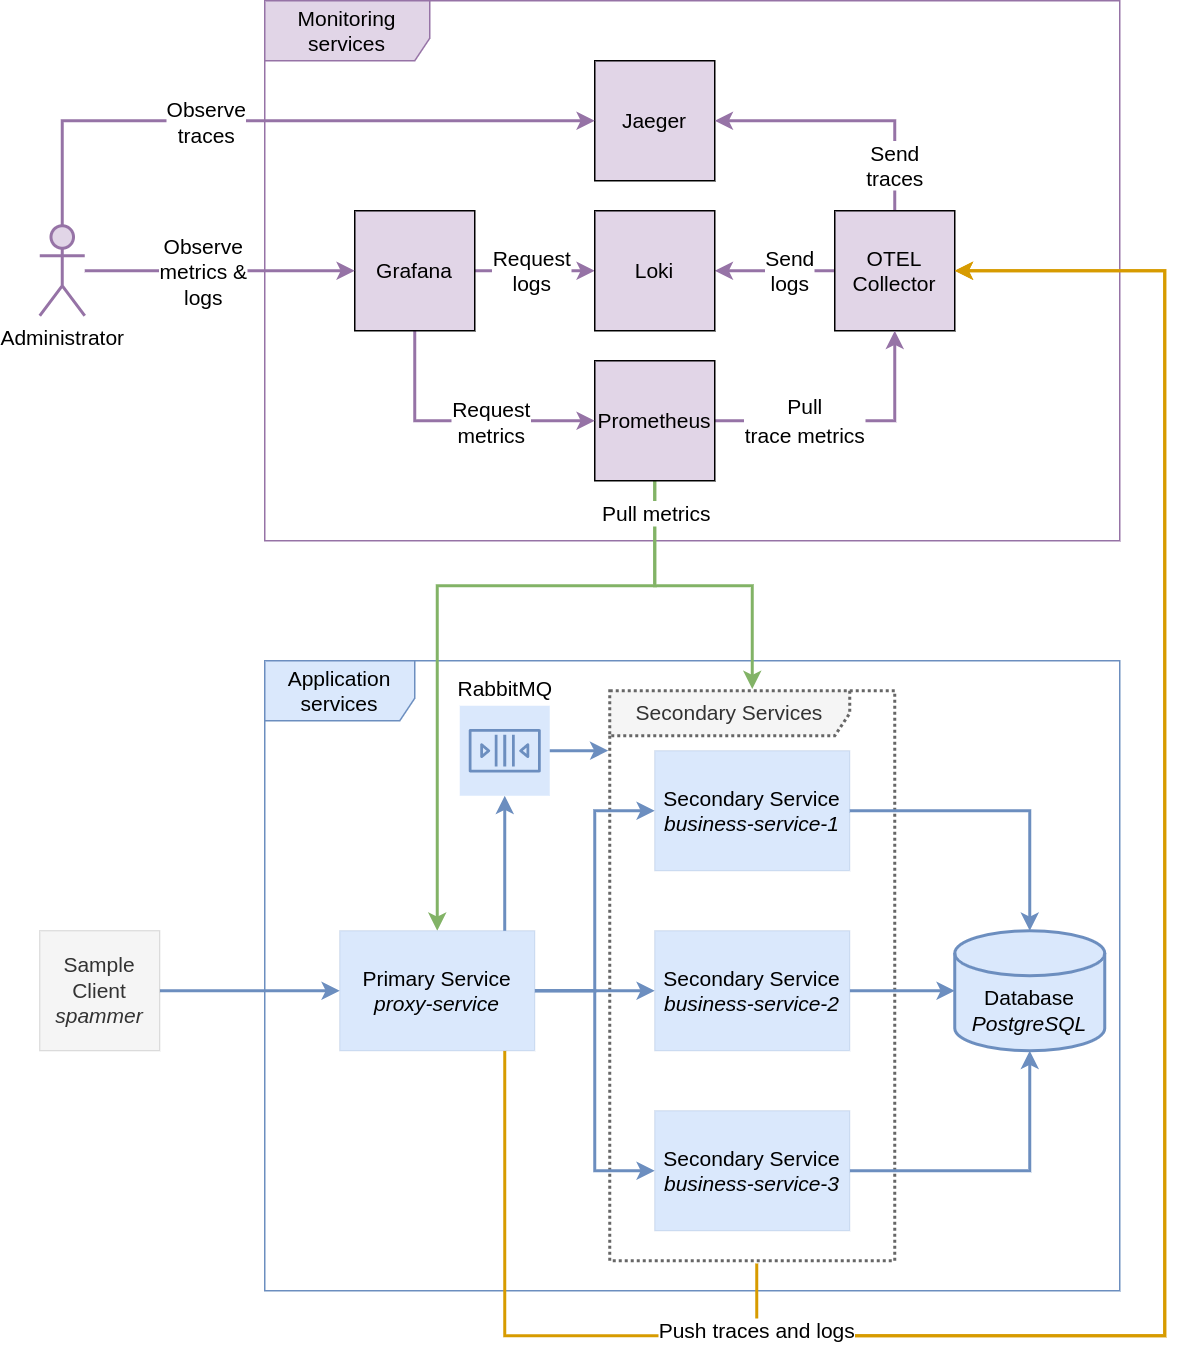
The goal of this project is to play around with exporting .NET service metrics to Prometheus, tracing service-to-service communication with Jaeger, and collecting logs with Loki using OpenTelementry .NET SDK.
Two .NET services have been implemented:
The first one is SampleDotNetOTEL.BusinessService. It exposes 3 endpoints:
- Get fake auto-generated weather records from the database (PostgreSQL).
- Get
"Hello World"string - Get
"Hello {USER_NAME}"string for the passed username parameter.
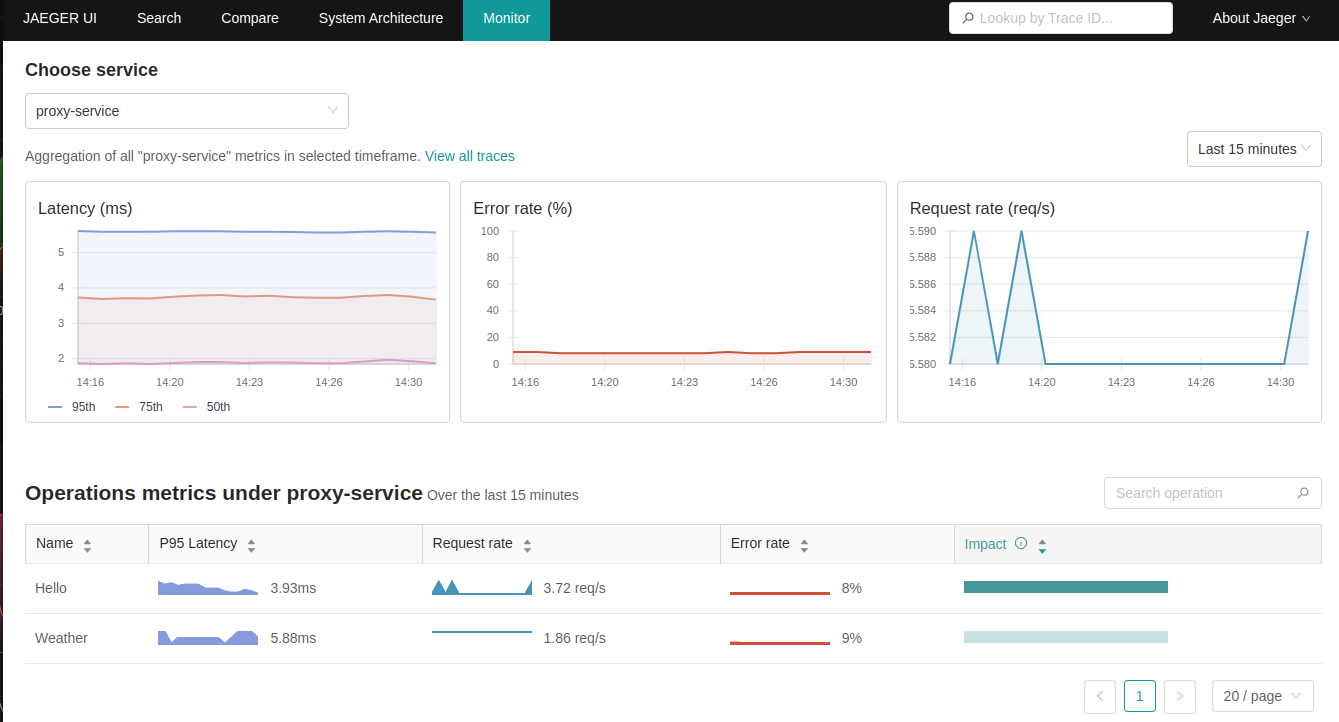
Also SampleDotNetOTEL.BusinessService has injected "faults" to simulate service errors.
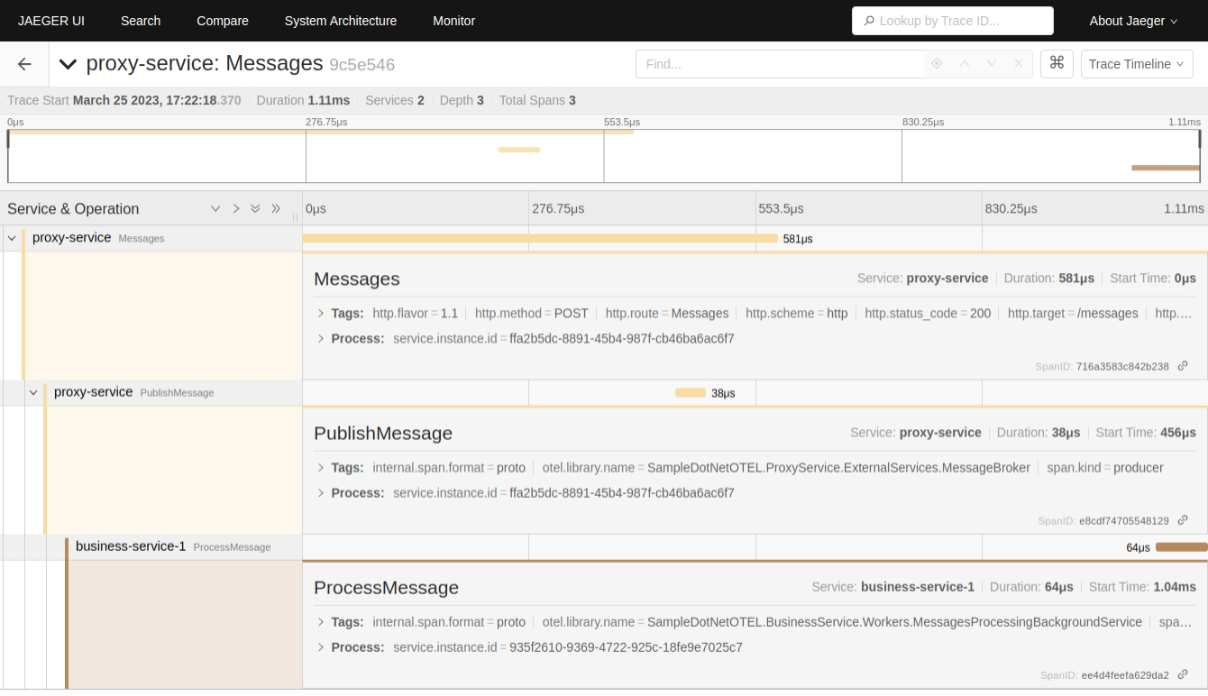
And also SampleDotNetOTEL.BusinessService reads messages from RabbitMQ and logs them.
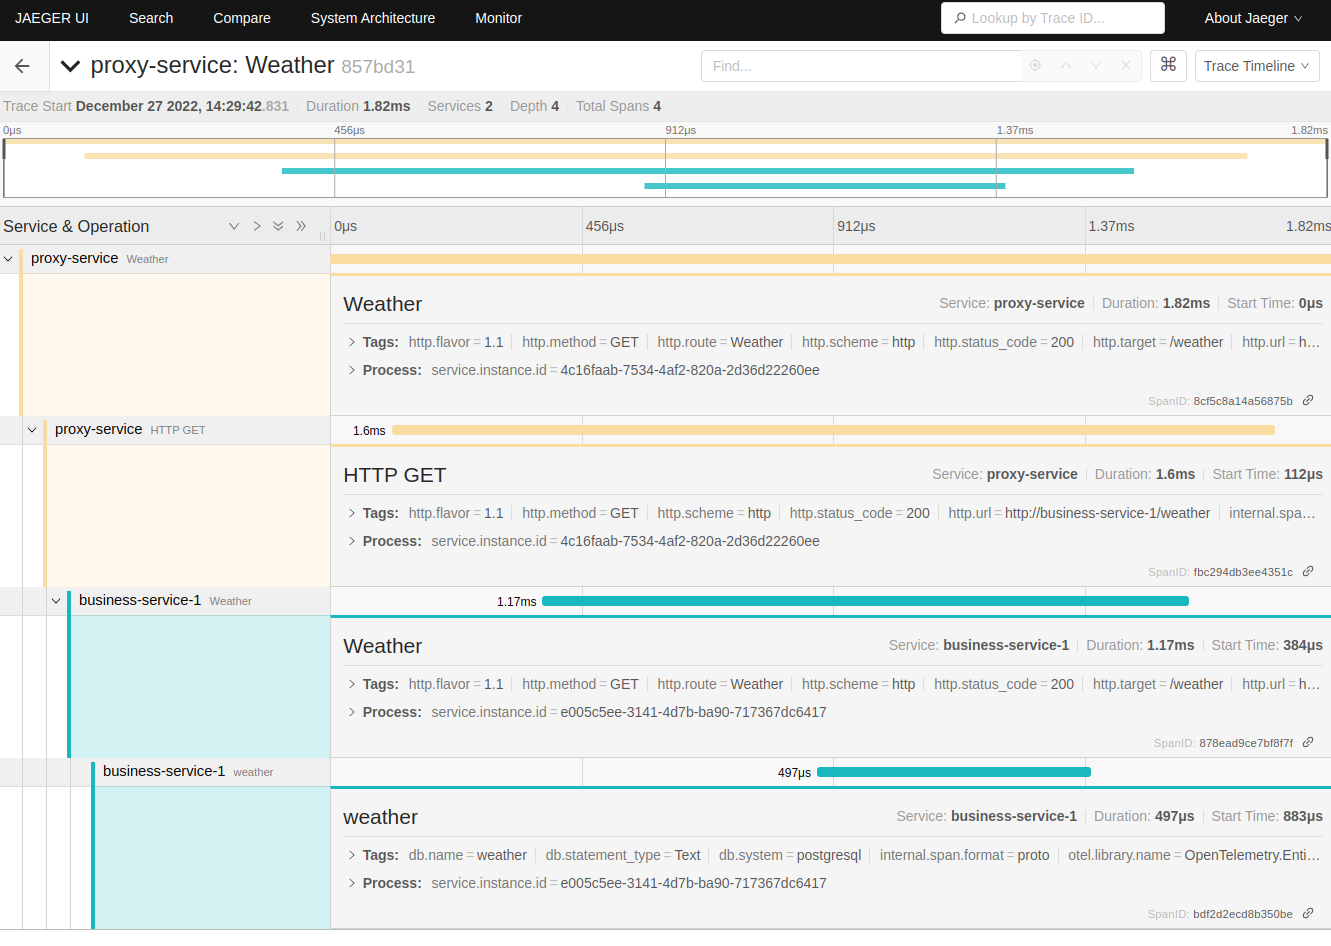
The second one is SampleDotNetOTEL.ProxyService. It exposes the same 3 endpoints as the first service but it just makes an HTTP request to SampleDotNetOTEL.BusinessService and forwards the response as it is.
Also, it provides the fourth endpoint to POST message which will be queued to RabbitMQ and later read by SampleDotNetOTEL.BusinessService to log it.
All services could be run with docker-compose.
docker-compose.yml contains as one of the services a dummy client called spammer which makes requests to 3 endpoints every half a second.
- Ensure you have
Dockerinstalled and running. - Ensure you have
docker-composeinstalled. - Run
docker-compose build - Run
docker-compose up - As soon as
docker-composestarts services they should be available via HTTP. Here are some links:- Grafana pre-build dashboard should be accessible via http://localhost:3000/d/KdDACDp4z/asp-net-otel-metrics
- Jaeger should be accessible via http://localhost:16686/search
- Prometheus should be accessible via http://localhost:9090/graph
- Proxy service should be accessible via http://localhost:8080/hello
Dashboard: https://grafana.com/grafana/dashboards/17706-asp-net-otel-metrics
Note: due to regular updates in OTEL metric names, ensure you download the appropriate dashboard revision.
Interested in contributing? Check out our CONTRIBUTING.md for guidelines on how to make this project even better!
