Here you can see all the code for the data visualizations I build using matplotlib.
Please note that I am new to python, so the code might not be the best or the most efficient.
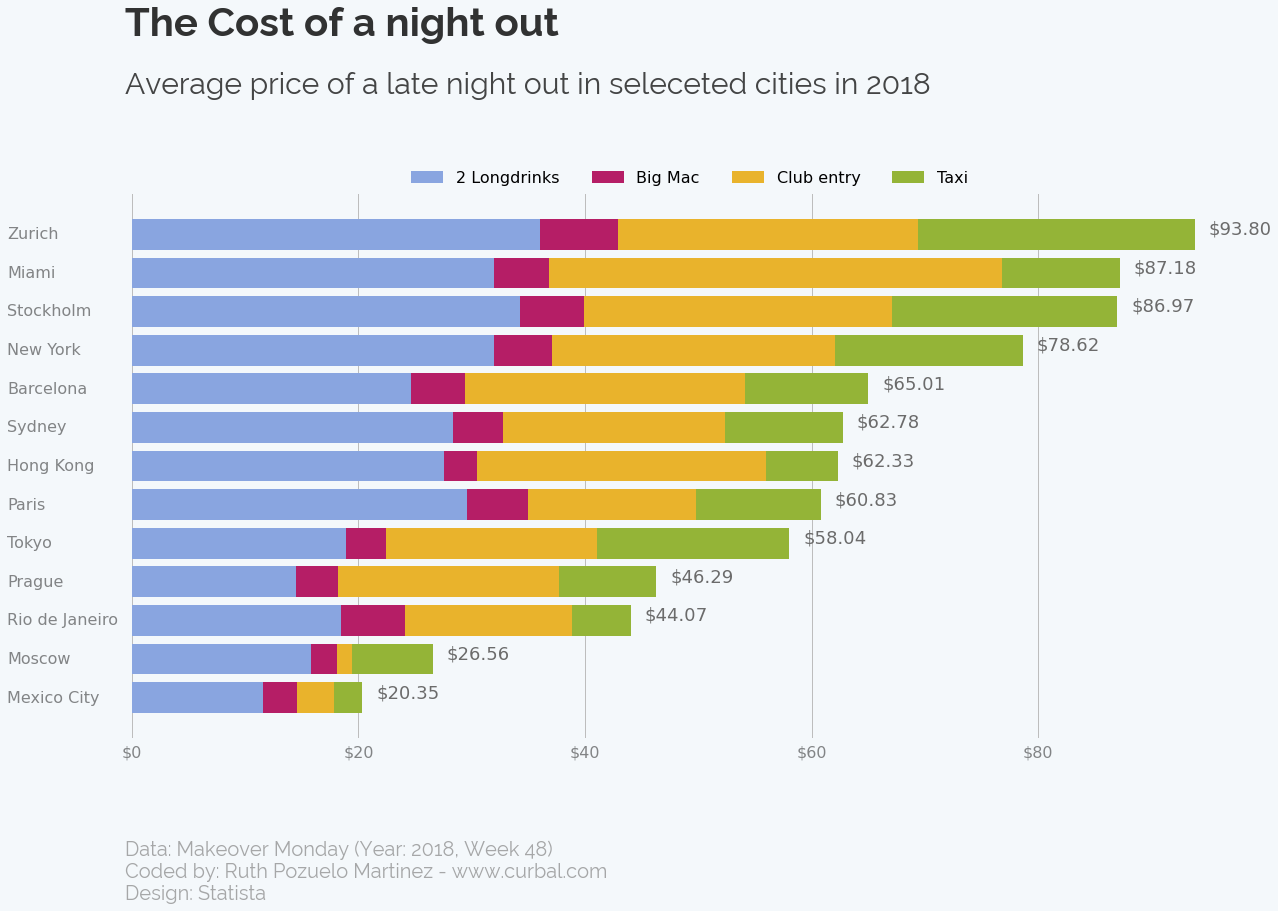
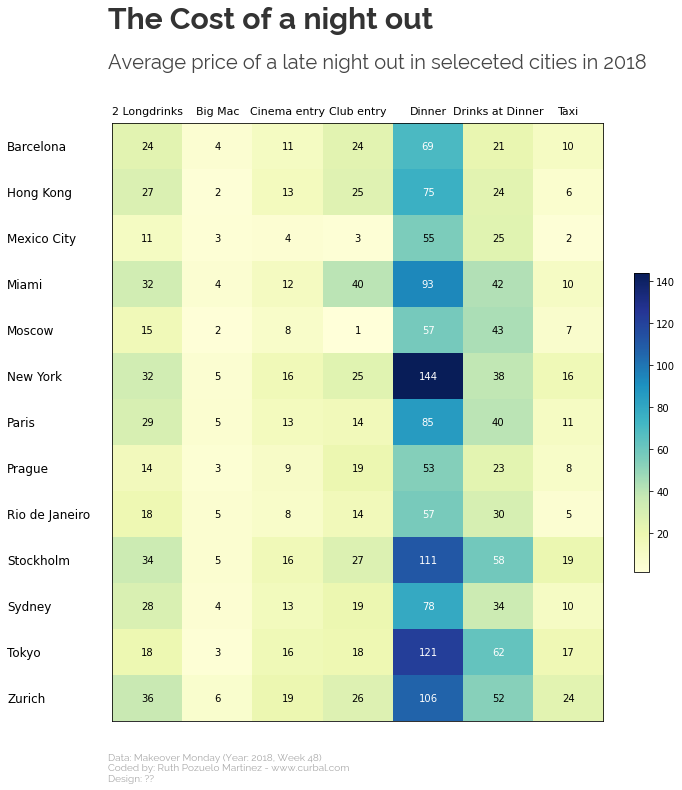
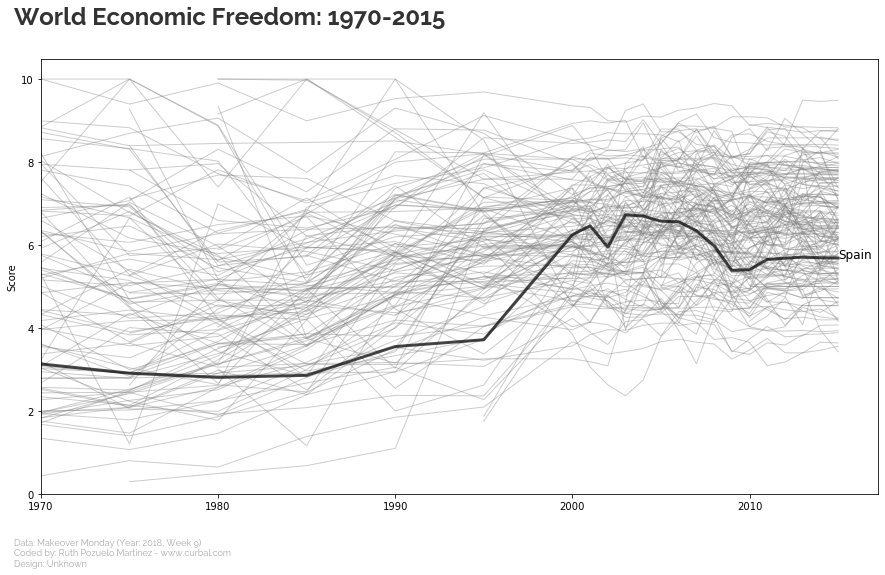
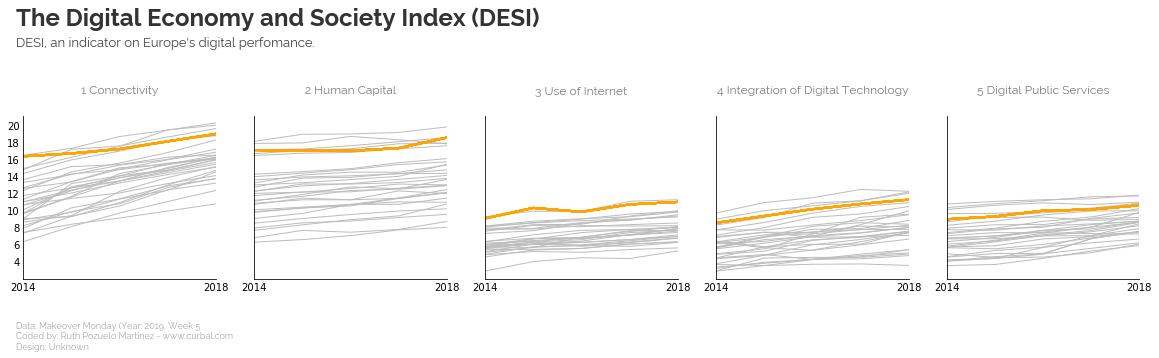
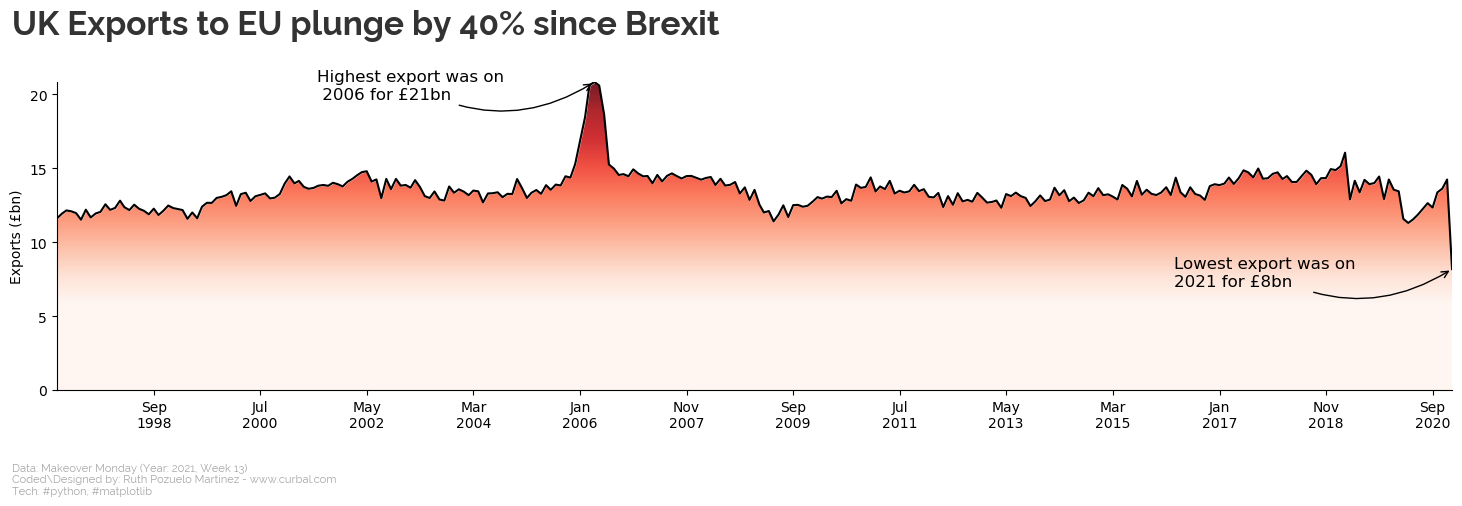
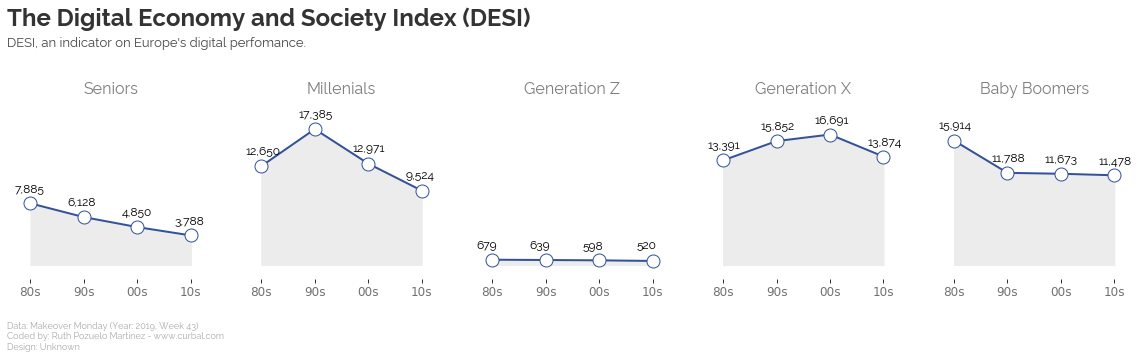
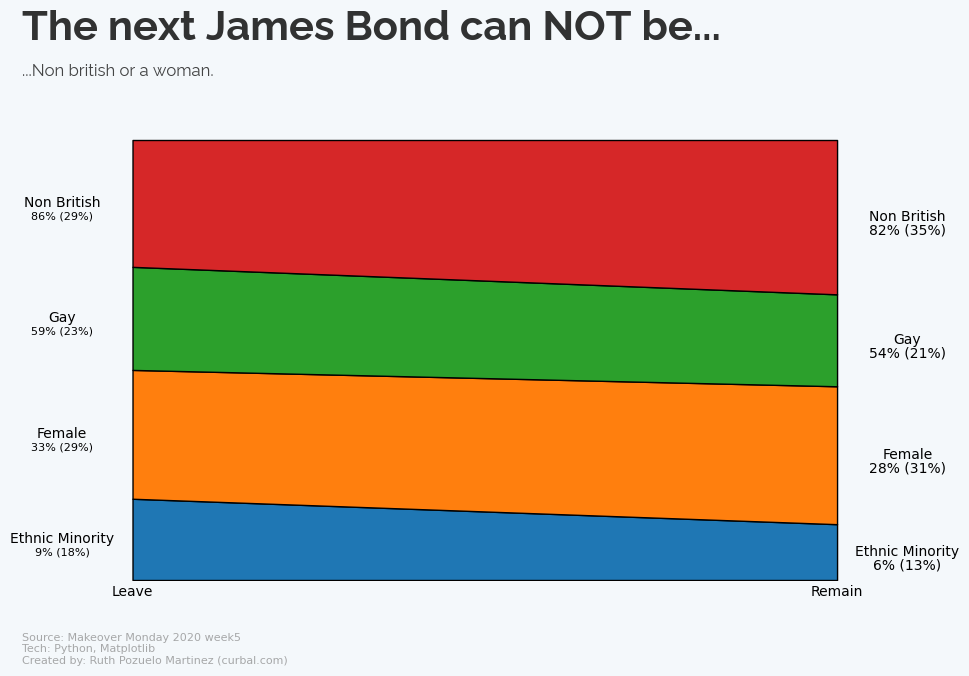
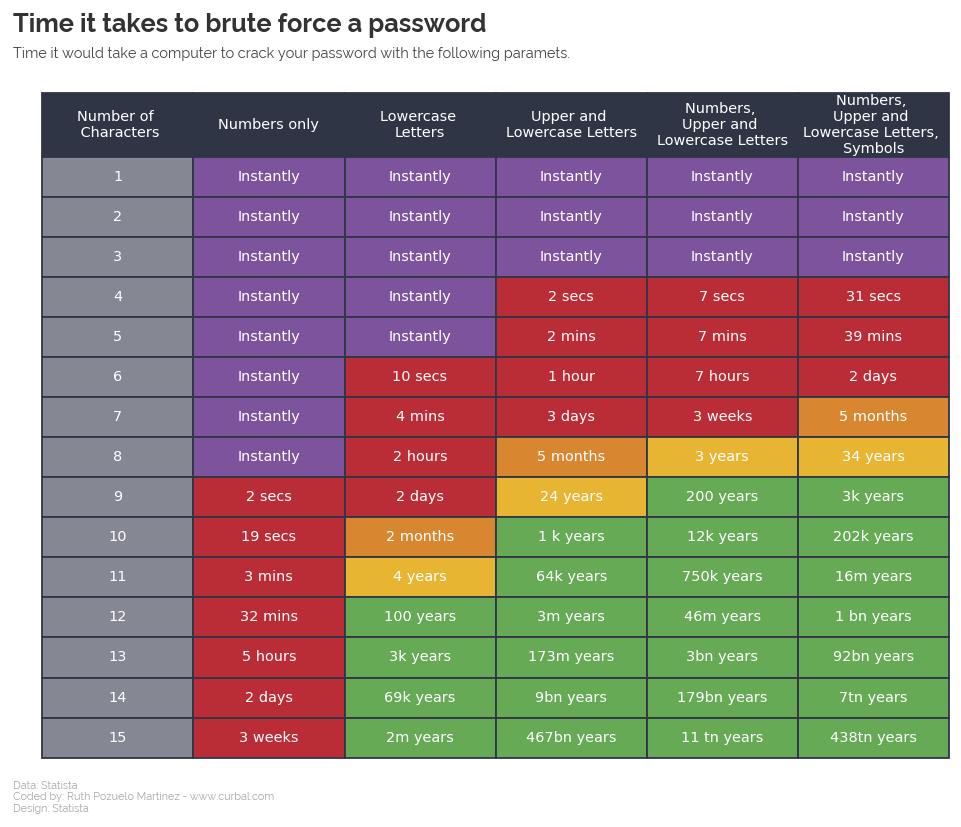
Most of the labs use Makeover Monday datasets. The file name indicates the year and month.

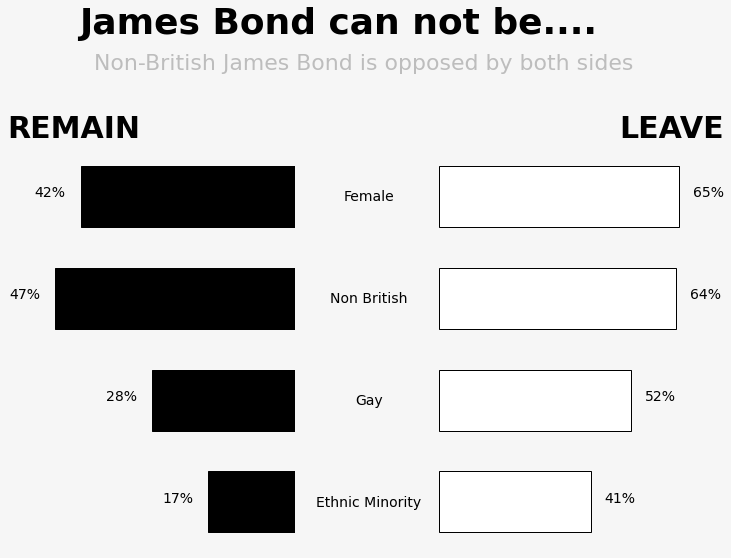
Horizontal:
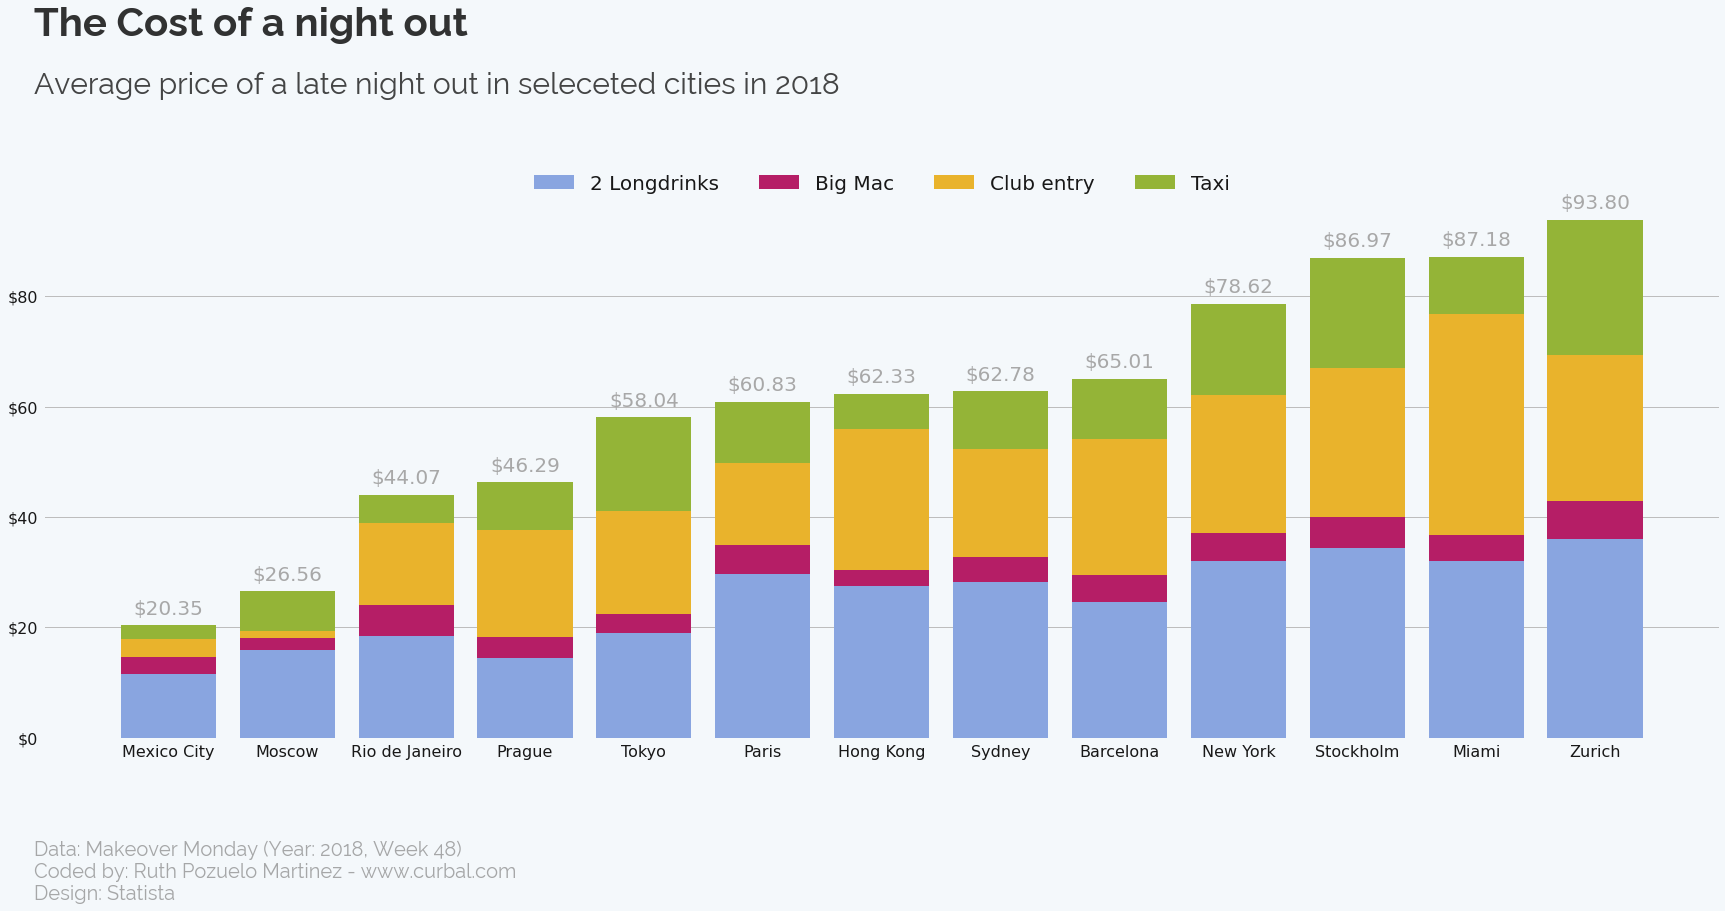
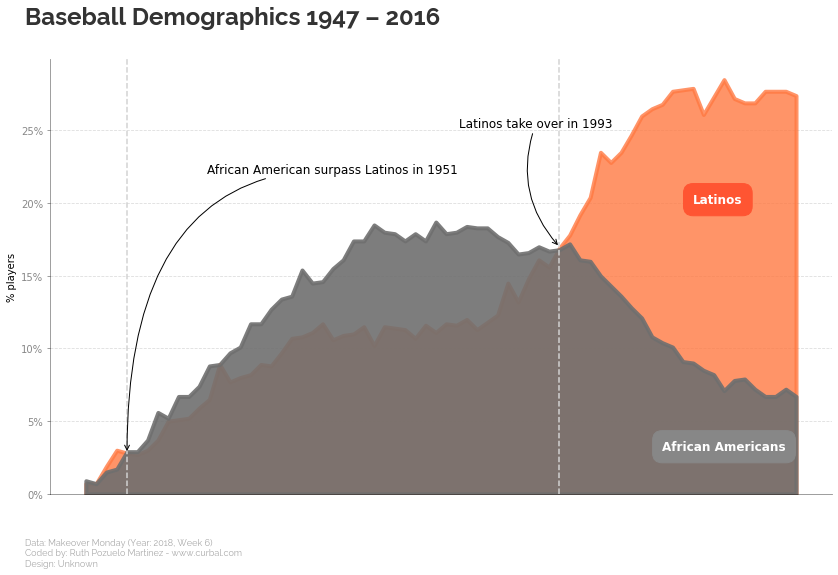
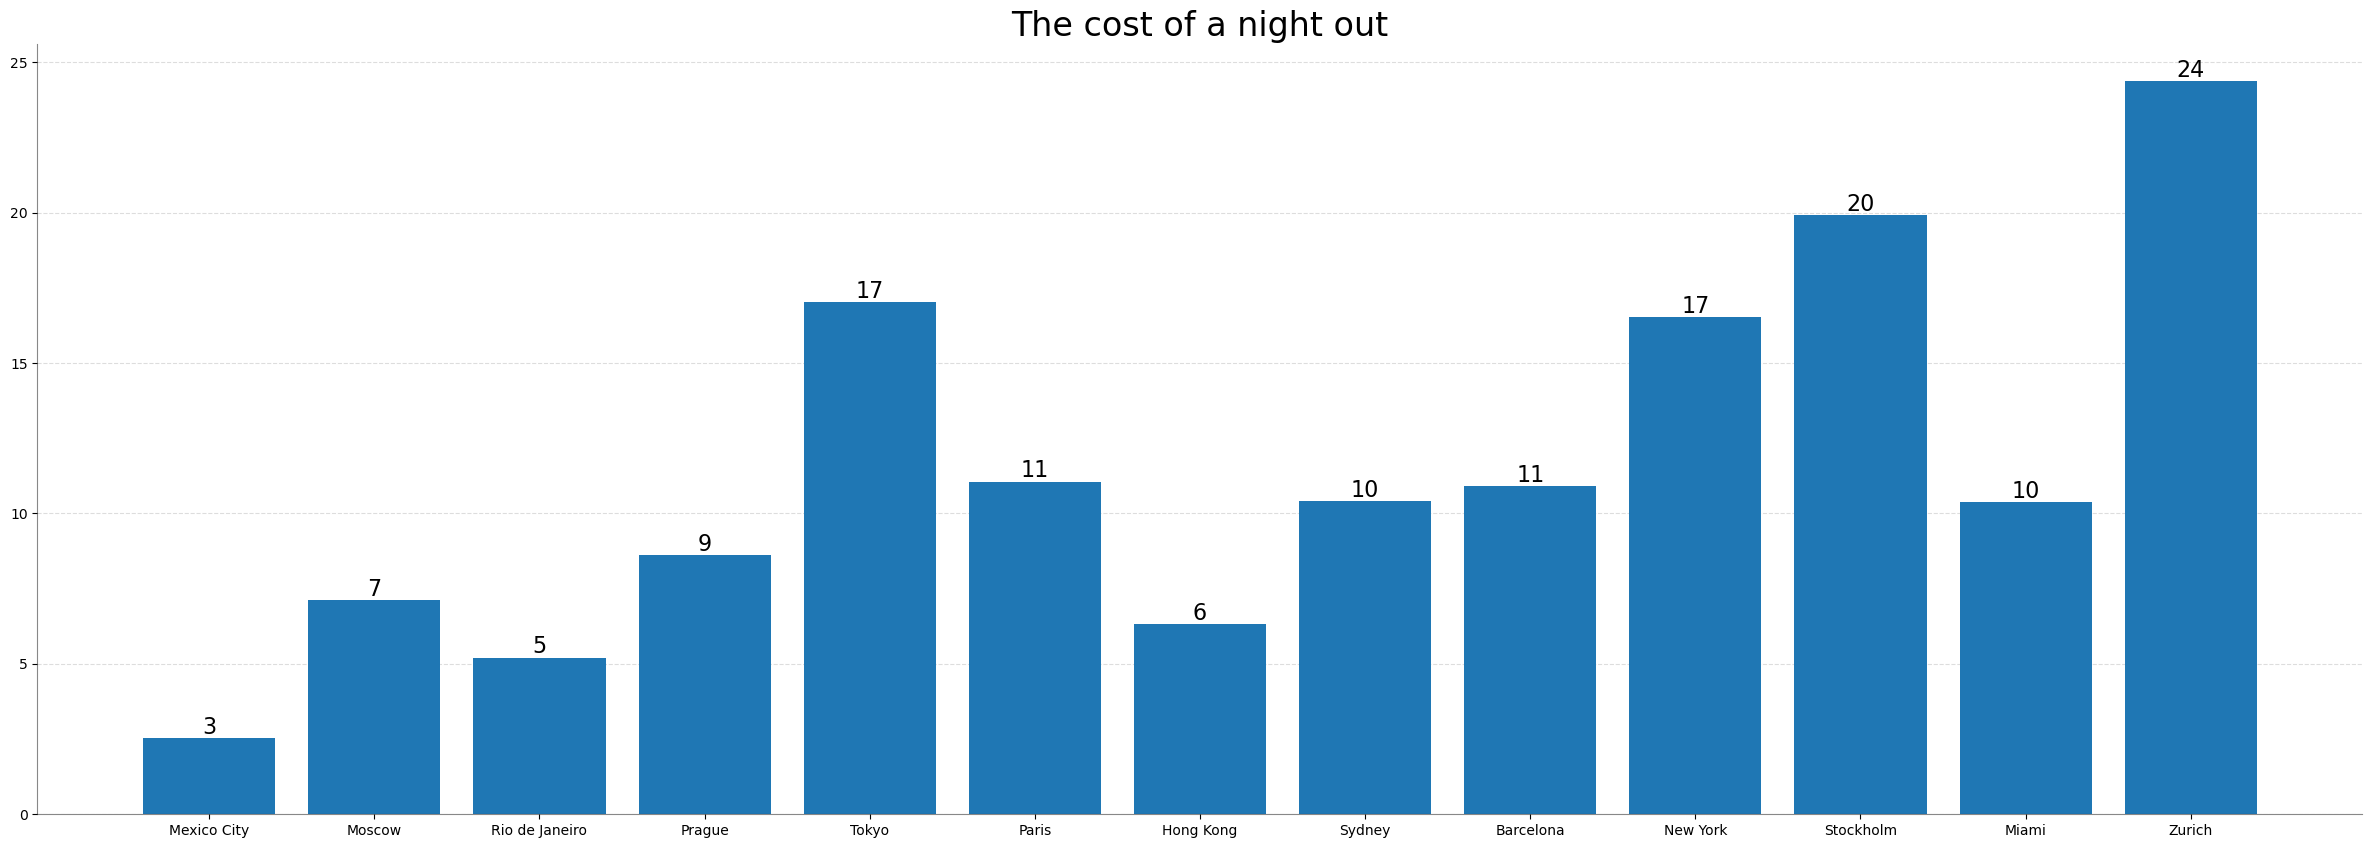
Vertical: