To access the report click here
The project was developed and published using Power BI, one of the top leader in business Intelligence.
The data used was provided for educational purposes by Power BI - Data Analysis and Business Intelligence course on the Udemy platform.
First Part
Second Part
Modifications were made to the original data using the Power Query editor to be able to use them appropriately.
The modifications were:
- In some cases it was necessary to use the "Use First Row as Headers" option to accommodate the imported data.
- A conditional column was created to add a new category called "Cantidad Poblacional"
- A conditional column was created to add a new category called "Mortalidad Infantil (Muertes cada 1000 niños)"
- A conditional column was created to add a new category called "Esperanza de Vida (Años promedio)"
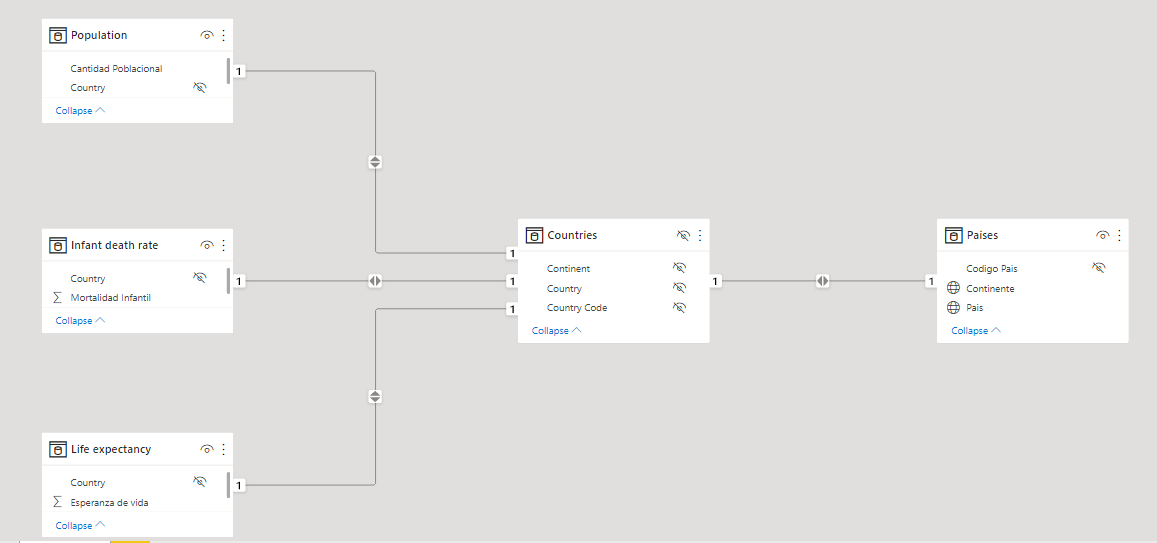
It was required to relate common data between the files:
- The data named "Country" from the file Population and Countries were related.
- The data named "Country code" from the file Population, and data named "Codigo pais" from the file Countries were related.
- The data named "Country" from the file Countries and Infant death rate were related.
- The data named "Country" from the file Countries and Life Expectancy were related.
This is an interactive report divided into two parts. The first is an analysis of the population quantity seen by countries and continents. The second relies on the first part with additional information from the world indicators of infant death rate and life expectancy.
Different types of visualizations were used to represent the behavior of the data, such as maps, treemaps, tables, and scatter charts.
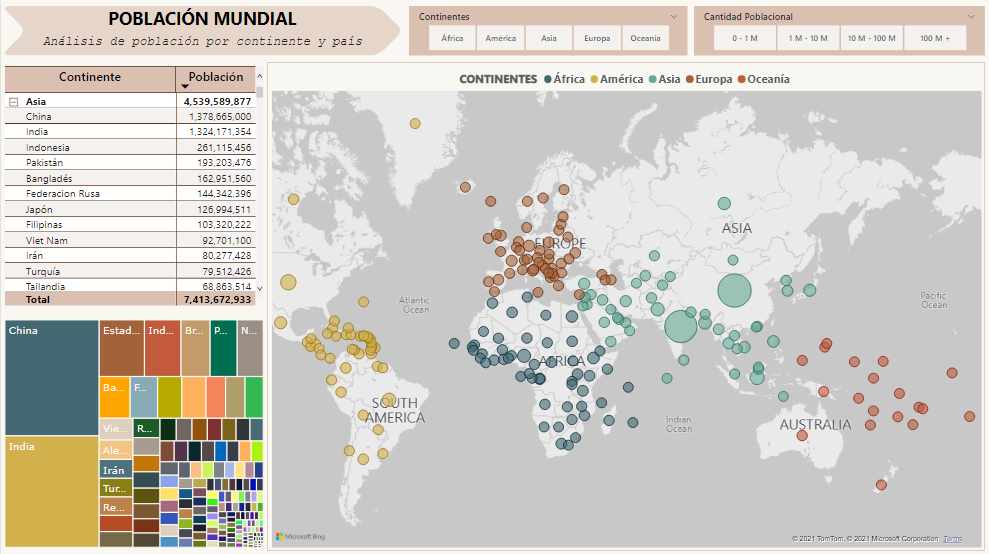
In the first part, the visualizations with the data of continent and population size make easy different forms of analysis. Below you can see a snapshot from the first part of the report:
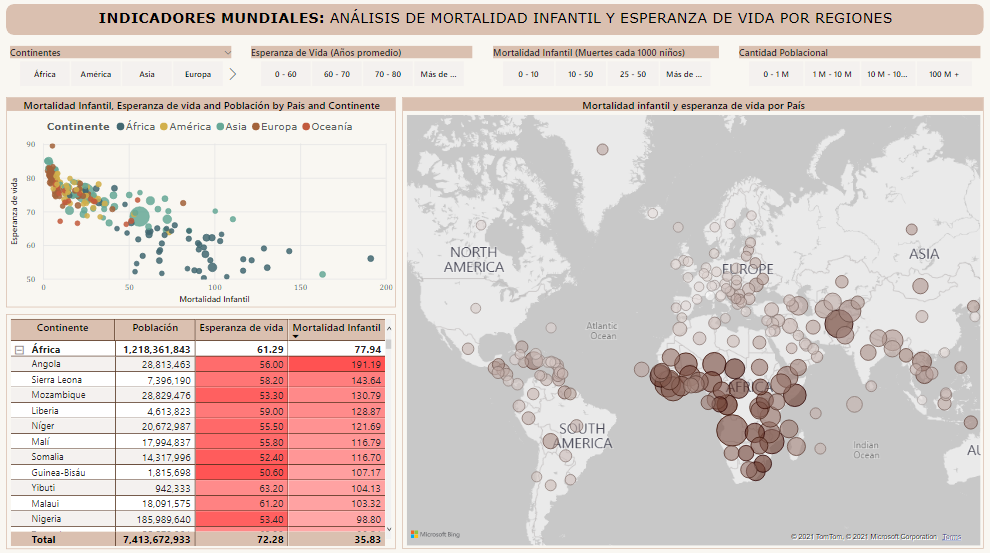
In the second part, the data of continent, population size, average of life expectancy and average of infant death rate make easy different forms of analysis. In the report, it is possible to analyze correlations between the data on infant death rate and life expectancy. Below you can see a snapshot from the second part of the report: