geth + lighthouse beacon/validator + mev-boost (coming soon) + metrics
- optional create alchemy and infura eth1/eth2 api endpoints.
- create a new
.envfile and add the following
BEACON_ENDPOINTS=http://beacon:5052,https://YOUR_API_KEY-beacon-mainnet.infura.io
FEE_RECIPIENT=0xYourAddress
EXECUTION_ENDPOINT=http://geth:8551- import validator keys (instructions below)
- run
dc up -d geth beacon - copy
geth/mainnet/jwtsecretto.lighthouse/jwtsecret - run
dc stop geth beacon && dc up -dto launch all the nodes - that's it! beacon and validators will use the backup eth1/eth2 apis until your node is synced
- generate validator keys via eth2 launchpaid
- import validator keys:
dc run --rm lighthouse-base lighthouse --network mainnet account validator import --directory /root/validator_keys
See https://lighthouse-book.sigmaprime.io/slashing-protection.html
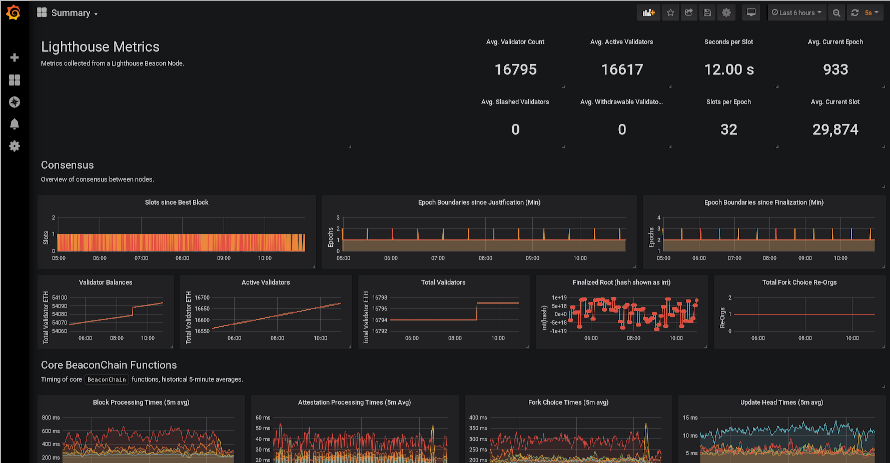
Provides a docker-compose environment which scrapes metrics from Lighthouse
nodes using Prometheus and presents them in a browser-based Grafana GUI.
- Start a lighthouse node with
$ lighthouse beacon --metrics- The
--metricsflag is required for metrics.
- The
- Bring the environment up with
$ docker-compose up --build. - Ensure that Prometheus can access your Lighthouse node by ensuring it is in
the
UPstate at http://localhost:9090/targets. - Browse to http://localhost:3000
- Username:
admin - Password:
changeme
- Username:
- Import some dashboards from the
dashboardsdirectory in this repo:- In the Grafana UI, go to
Dashboards->Manage->Import->Upload .json file. - The
Summary.jsondashboard is a good place to start.
- In the Grafana UI, go to
By default Prometheus and Grafana will only bind to localhost (127.0.0.1), in
order to protect you from accidentally exposing them to the public internet. If
you would like to change this you must edit the http_addr in grafana.ini.
The Lighthouse team has a hosted version of this stack where we do the majority of the monitoring. The dashboards in this repo are not guaranteed to be kept updated as we add/modify metrics to Lighthouse. If you're having problems, please reach out and we can update the dashboards here.
Feel free to create your own dashboards, export them and submit them here as PRs.