Data visualization javascript library.
A easy way to visualize data in javascript.
vnix is based on raphael.js
Lightweight and configurable.
The motivation of creating vnix is to fulfil the wdm project.
- bubble chart
- donut chart
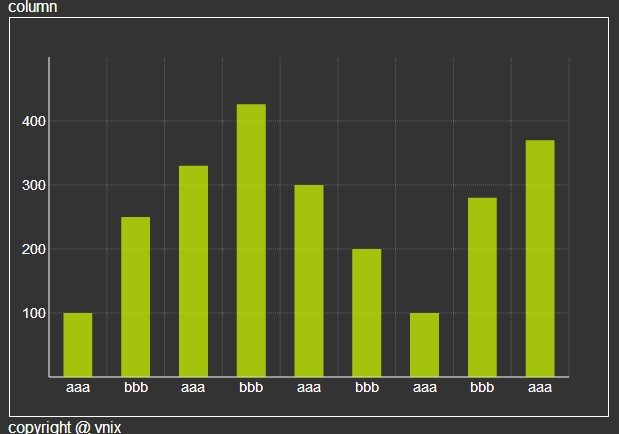
- column chart
- spline chart
- radar chart (fit with wdm.taobao.com)
- gender pie chart (fit with wdm.taobao.com)
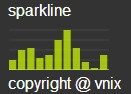
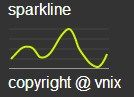
- sparkline chart (with spline,line,bar types for options)
- column:
- spline:
- sparkline:
vnix.date.js is a lib for chinese lunar date call. one can transform a timestamp to a lunar date string so that can do more things like festival filter and so on.