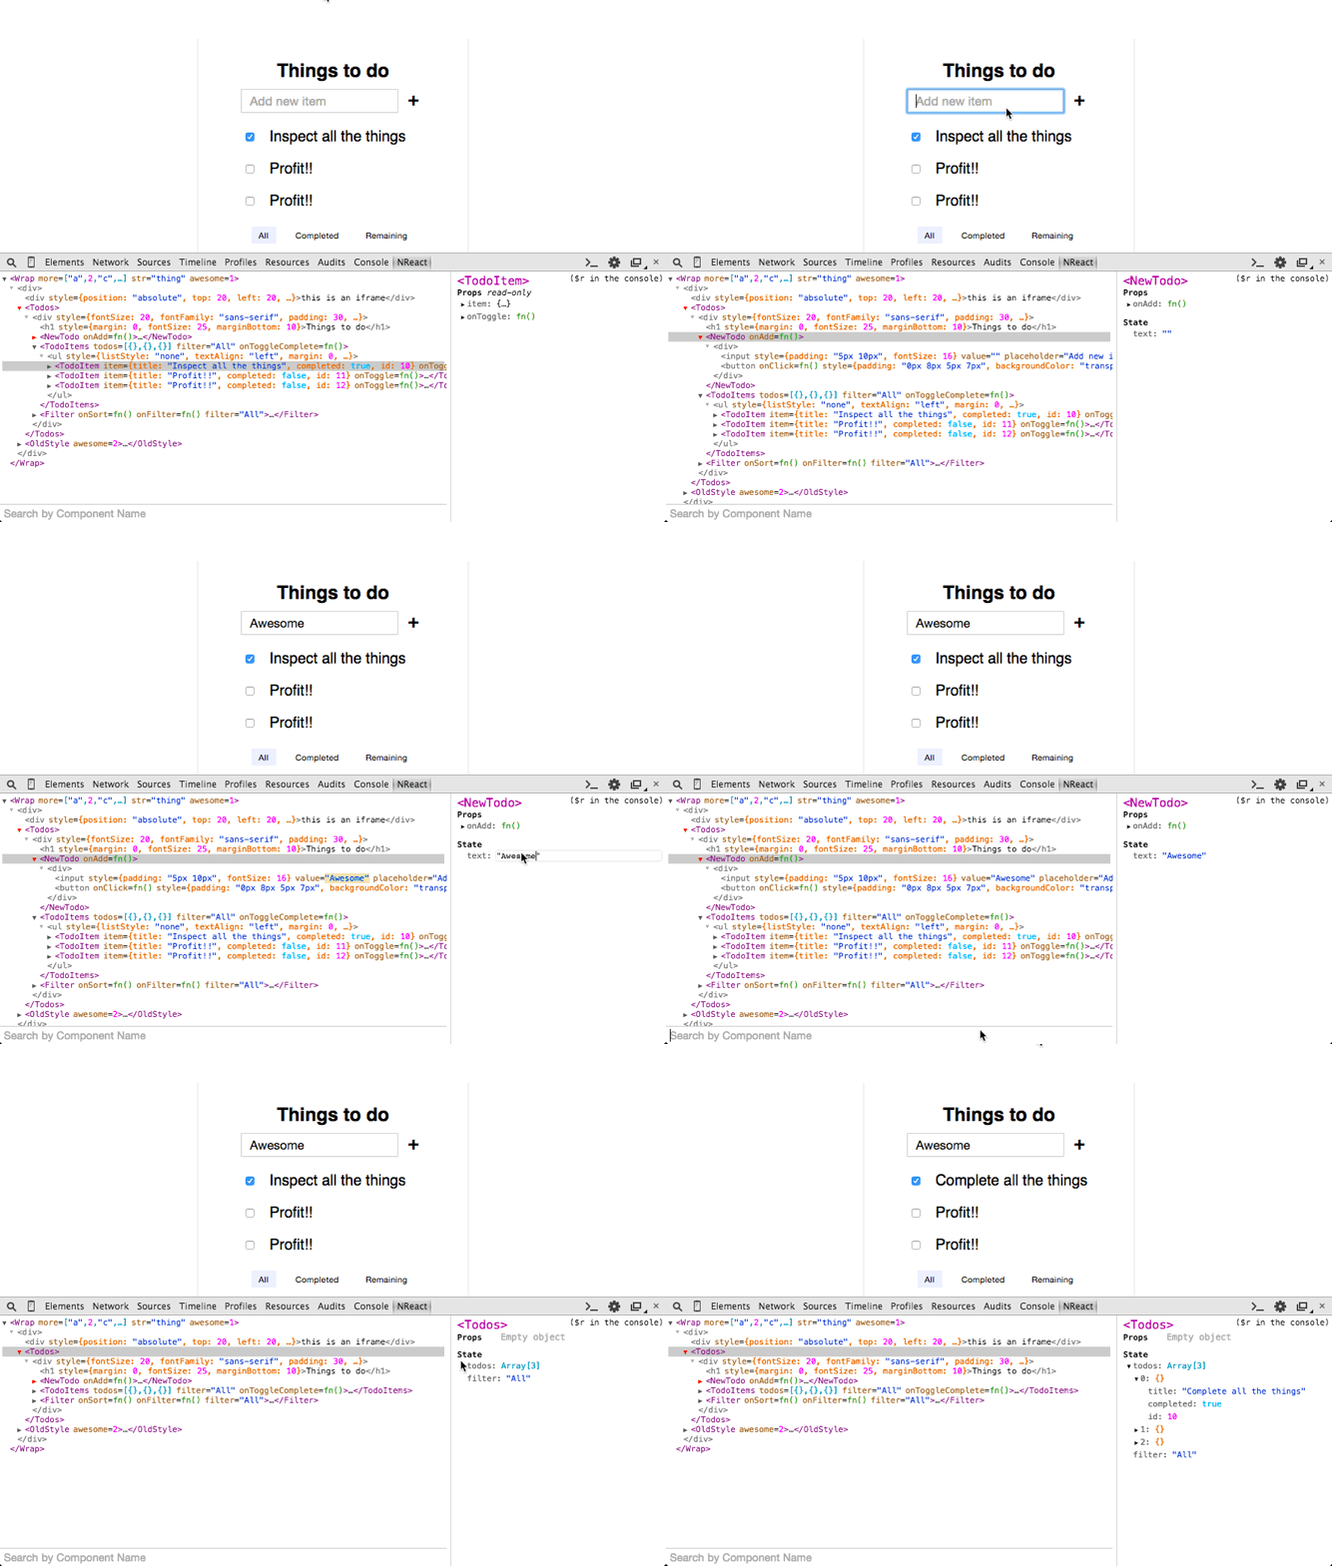
This is a fork of react-devtools that makes the electron app listen over https instead of http, letting you access it from inside an https iframe.
To install:
git clone https://github.com/mikeyhew/react-devtools
cd react-devtools
npm install
cd packages/react-devtools
npm install -g .
Now you should be able to run the app with react-devtools. It will take several seconds to start up, because it needs to generate a self-signed SSL certificate. In the future, it should only do this once and cache the certificate on the filesystem, but for now it generates a new certificate every time.
To use this in Google Chrome, make sure you enable the insecure localhost flag at chrome://flags/#allow-insecure-localhost.
React Developer Tools lets you inspect the React component hierarchy, including component props and state.
It exists both as a browser extension (for Chrome and Firefox), and as a standalone app (works with other environments including Safari, IE, and React Native).
The official extensions represent the current stable release.
Opera users can enable Chrome extensions and then install the Chrome extension.
The extension icon will light up on the websites using React:
On such websites, you will see a tab called React in Chrome Developer Tools:
A quick way to bring up the DevTools is to right-click on the page and press Inspect.
- Arrow keys or hjkl for navigation
- Right click a component to show in elements pane, scroll into view, show source, etc.
- Differently-colored collapser means the component has state/context
- Right-click to store as global variable
- Updates are highlighted
- Use the search bar to find components by name
If you inspect a React element on the page using the regular Elements tab, then switch over to the React tab, that element will be automatically selected in the React tree.
You can right-click any React element in the React tab, and choose "Find the DOM node". This will bring you to the corresponding DOM node in the Elements tab.
You may include the transform-react-jsx-source Babel plugin to see the source file and line number of React elements. This information appears in the bottom of the right panel when available. Don't forget to disable it in production! (Tip: if you use Create React App it is already enabled in development.)
There is a standalone version that works with other environments such as React Native and Safari.
If you are running your app from a local file:// URL, don't forget to check "Allow access to file URLs" on the Chrome Extensions settings page. You can find it by opening Settings > Extensions:
Or you could develop with a local HTTP server like serve.
The React tab won't show up if the site doesn't use React, or if React can't communicate with the devtools. When the page loads, the devtools sets a global named __REACT_DEVTOOLS_GLOBAL_HOOK__, then React communicates with that hook during initialization. You can test this on the React website or by inspecting Facebook.
If your app is inside of CodePen, make sure you are registered. Then press Fork (if it's not your pen), and then choose Change View > Debug. The Debug view is inspectable with DevTools because it doesn't use an iframe.
If your app is inside an iframe, a Chrome extension, React Native, or in another unusual environment, try the standalone version instead. Chrome apps are currently not inspectable.
If you still have issues please report them. Don't forget to specify your OS, browser version, extension version, and the exact instructions to reproduce the issue with a screenshot.
With React 15 and earlier, "Highlight Updates" had false positives and highlighted more components than were actually re-rendering.
Since React 16, it correctly highlights only components that were re-rendered.
For changes that don't directly involve Chrome/Firefox/etc. APIs, there is a
"plain" shell that just renders the devtools into an html page along with a
TodoMVC test app. This is by far the quickest way to develop. Check out
the Readme.md in /shells/plain for info.
For other shells (Chrome, Firefox, etc.), see the respective directories in /shells.
For a list of good contribution opportunities, check the good first bug label. We're happy to answer any questions on those issues!
To read more about the community and guidelines for submitting pull requests, please read the Contributing document.
What to do if the extension breaks.
- check the error console of devtools. Part of React Devtools runs scripts in the context of your page, and is vulnerable to misbehaving polyfills.
- open devtools out into a new window, and then hit the shortcut to open devtools again (cmd+option+j or ctrl+shift+j). This is the "debug devtools" debugger. Check the console there for errors.
- open
chrome://extensions, find react devtools, and click "background page" under "Inspected views". You might find the errors there.


