Exploring Flood Mitigation Governance by Estimating First-Floor Elevation via Deep Learning and Google Street View in Coastal Texas
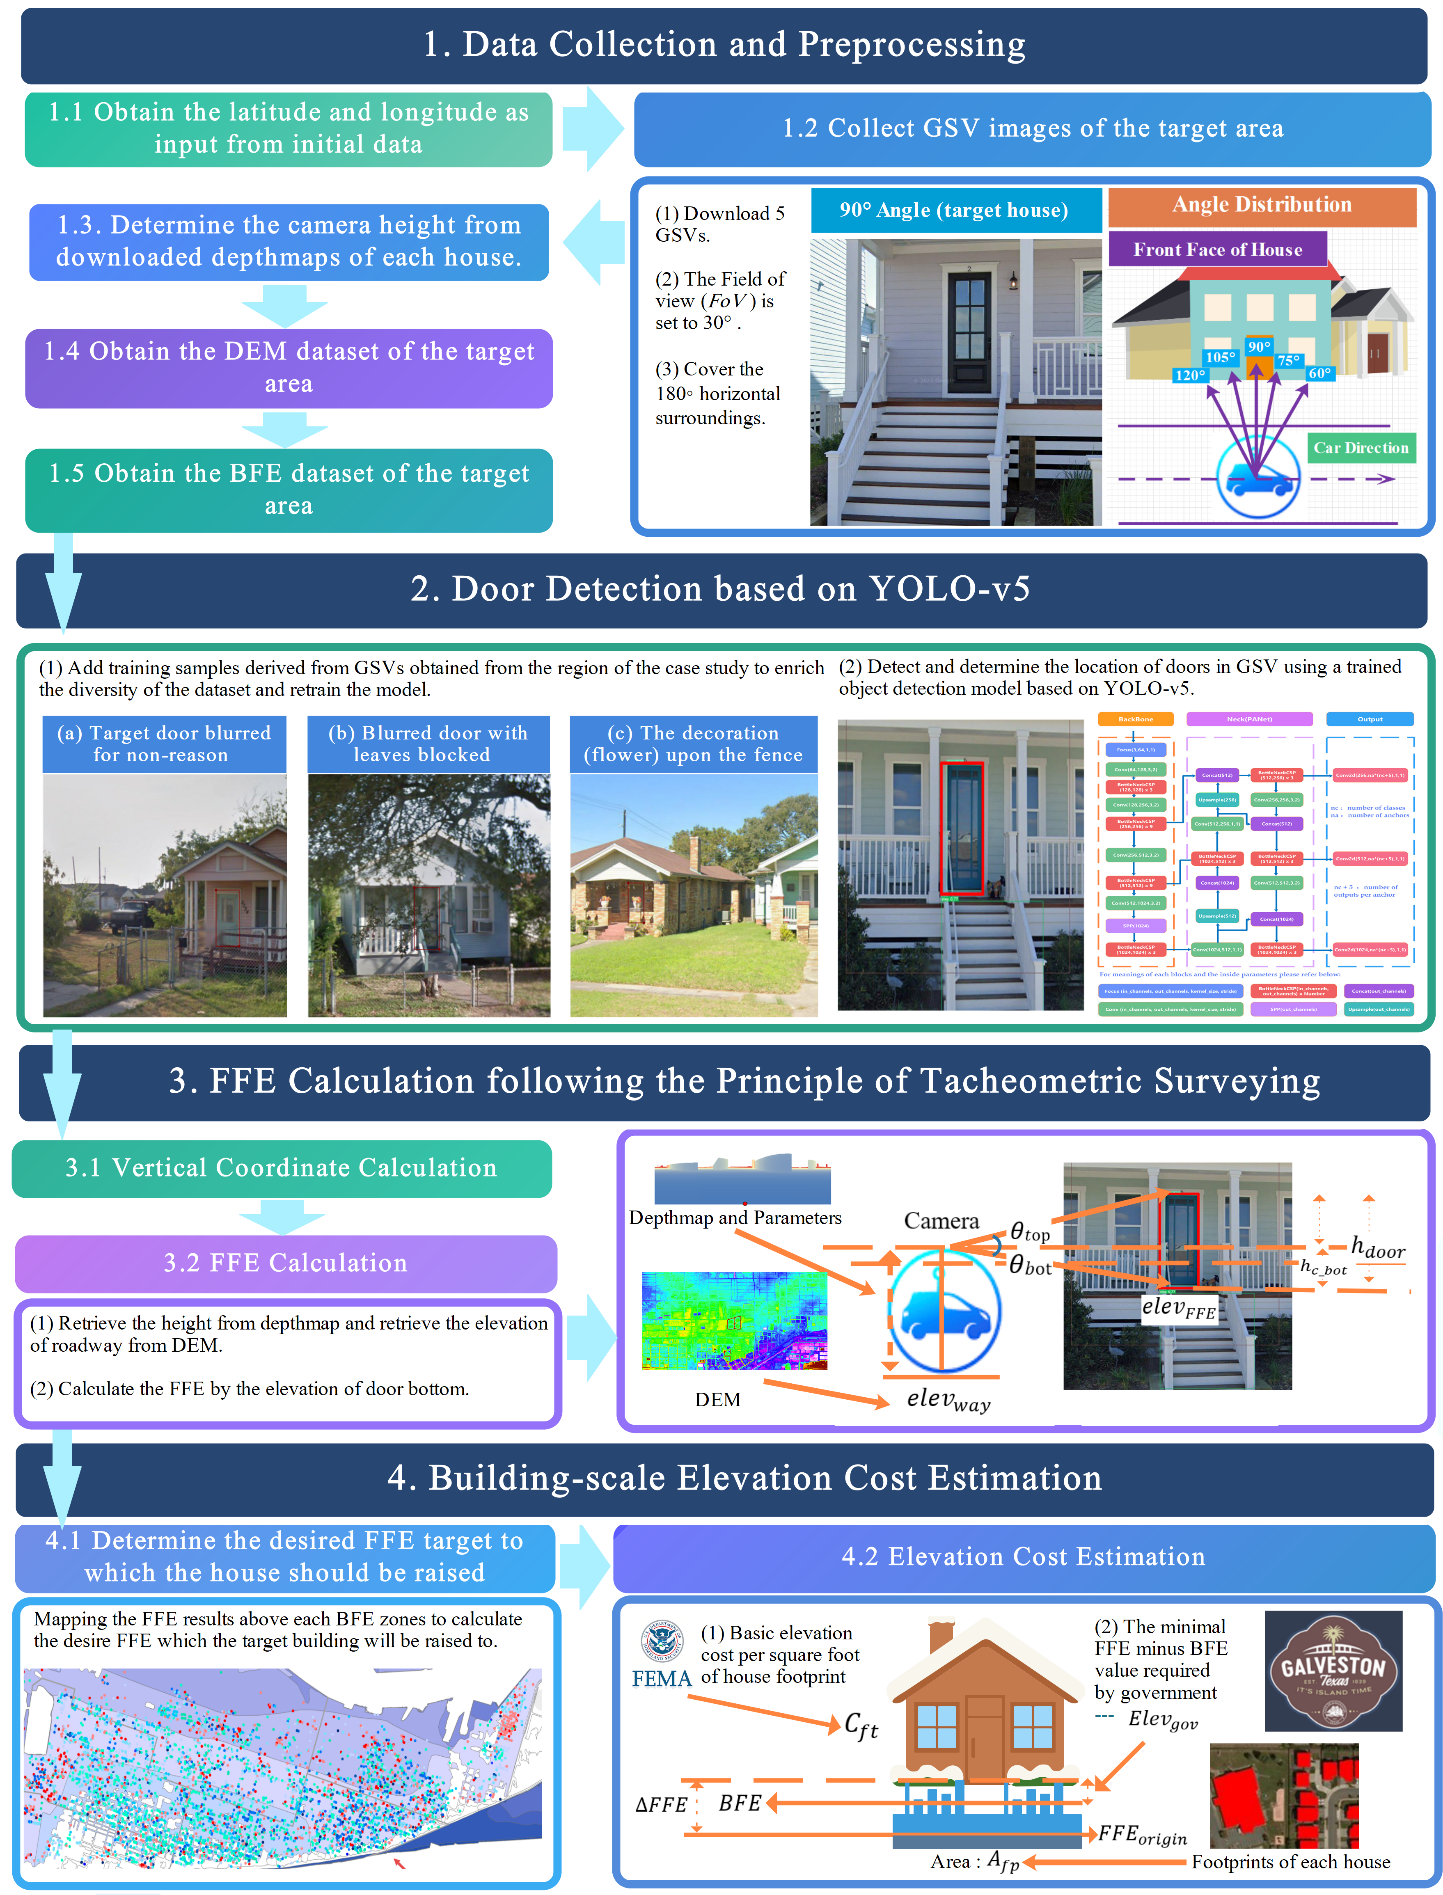
Fig. 1. The pipeline of the proposed workflow
To obtain and process target houses’ SVIs, the corresponding altitudes, azimuths, and angles of the field of view (FoV) should be recorded for further door detection and localization. Our proposed workflow to estimate the FFE for individual houses and perform building-scale elevation cost estimation contains the following steps (Figure 1):
- Obtain the latitude and longitude as input from initial data, which is derived from building footprints or the API provided by Google Map Platform (Geocoding API) based on the known addresses.
- Collect GSV images of the target area.
- Determine the camera height from the downloaded depthmaps of each house.
- Obtain the DEM dataset of the target area.
- Obtain the BFE dataset of the target area.
- Add training samples derived from GSVs obtained from the region of the case study to enrich the diversity of the dataset and retrain the model.
- Detect and determine the location of doors in GSV using a trained object detection model based on YOLO-v5.
- Calculate the vertical coordinates. Calculate the vertical coordinate of the door bottom to the camera center using its height and apex in the panorama.
- Calculate FFE. Calculate the FFE based on the predefined general door height and the door bottom elevation, which is obtained according to its vertical coordinate, the extracted roadway elevation, and the height from the camera to the roadway.
- Determine the desired FFE target to which the house should be raised by mapping FFE results over the obtained BFEs.
- Estimate the elevation cost. Perform building-scale elevation cost estimation for each residential building.
After validating the applicability of the calculation method using GSVs for three Galveston neighborhoods, we extended our workflow to all of Galveston Island.
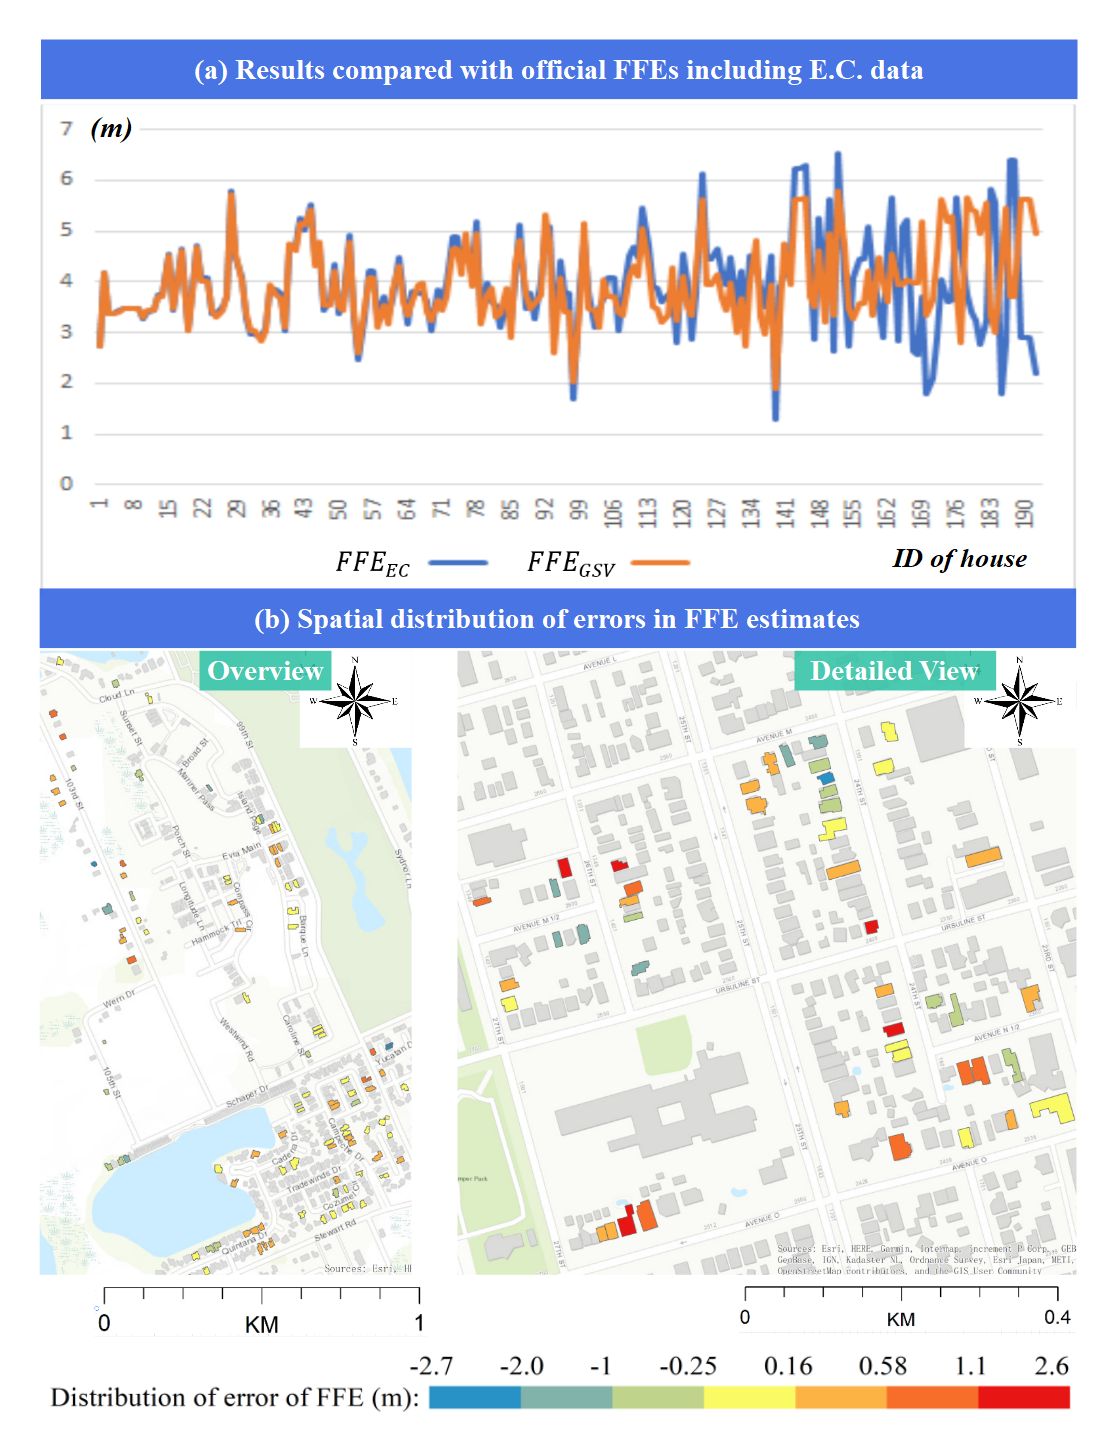
Fig. S1. (a) FFE data derived from our model compared with Galveston_FFEData2020 dataset, including E.C. dataset (b) Spatial distribution of errors associated with this comparison
As described in the Section G of the Supplementary Materials, 8,897 effective results remained after the entire procedure. From a total of 26,054 building footprints in Galveston, we successfully captured a total of 130,272 GSV images.; the overview of the data is depicted in the Section G of the Supplementary Materials, and the interactive dashboard is depicted in Figure 2.
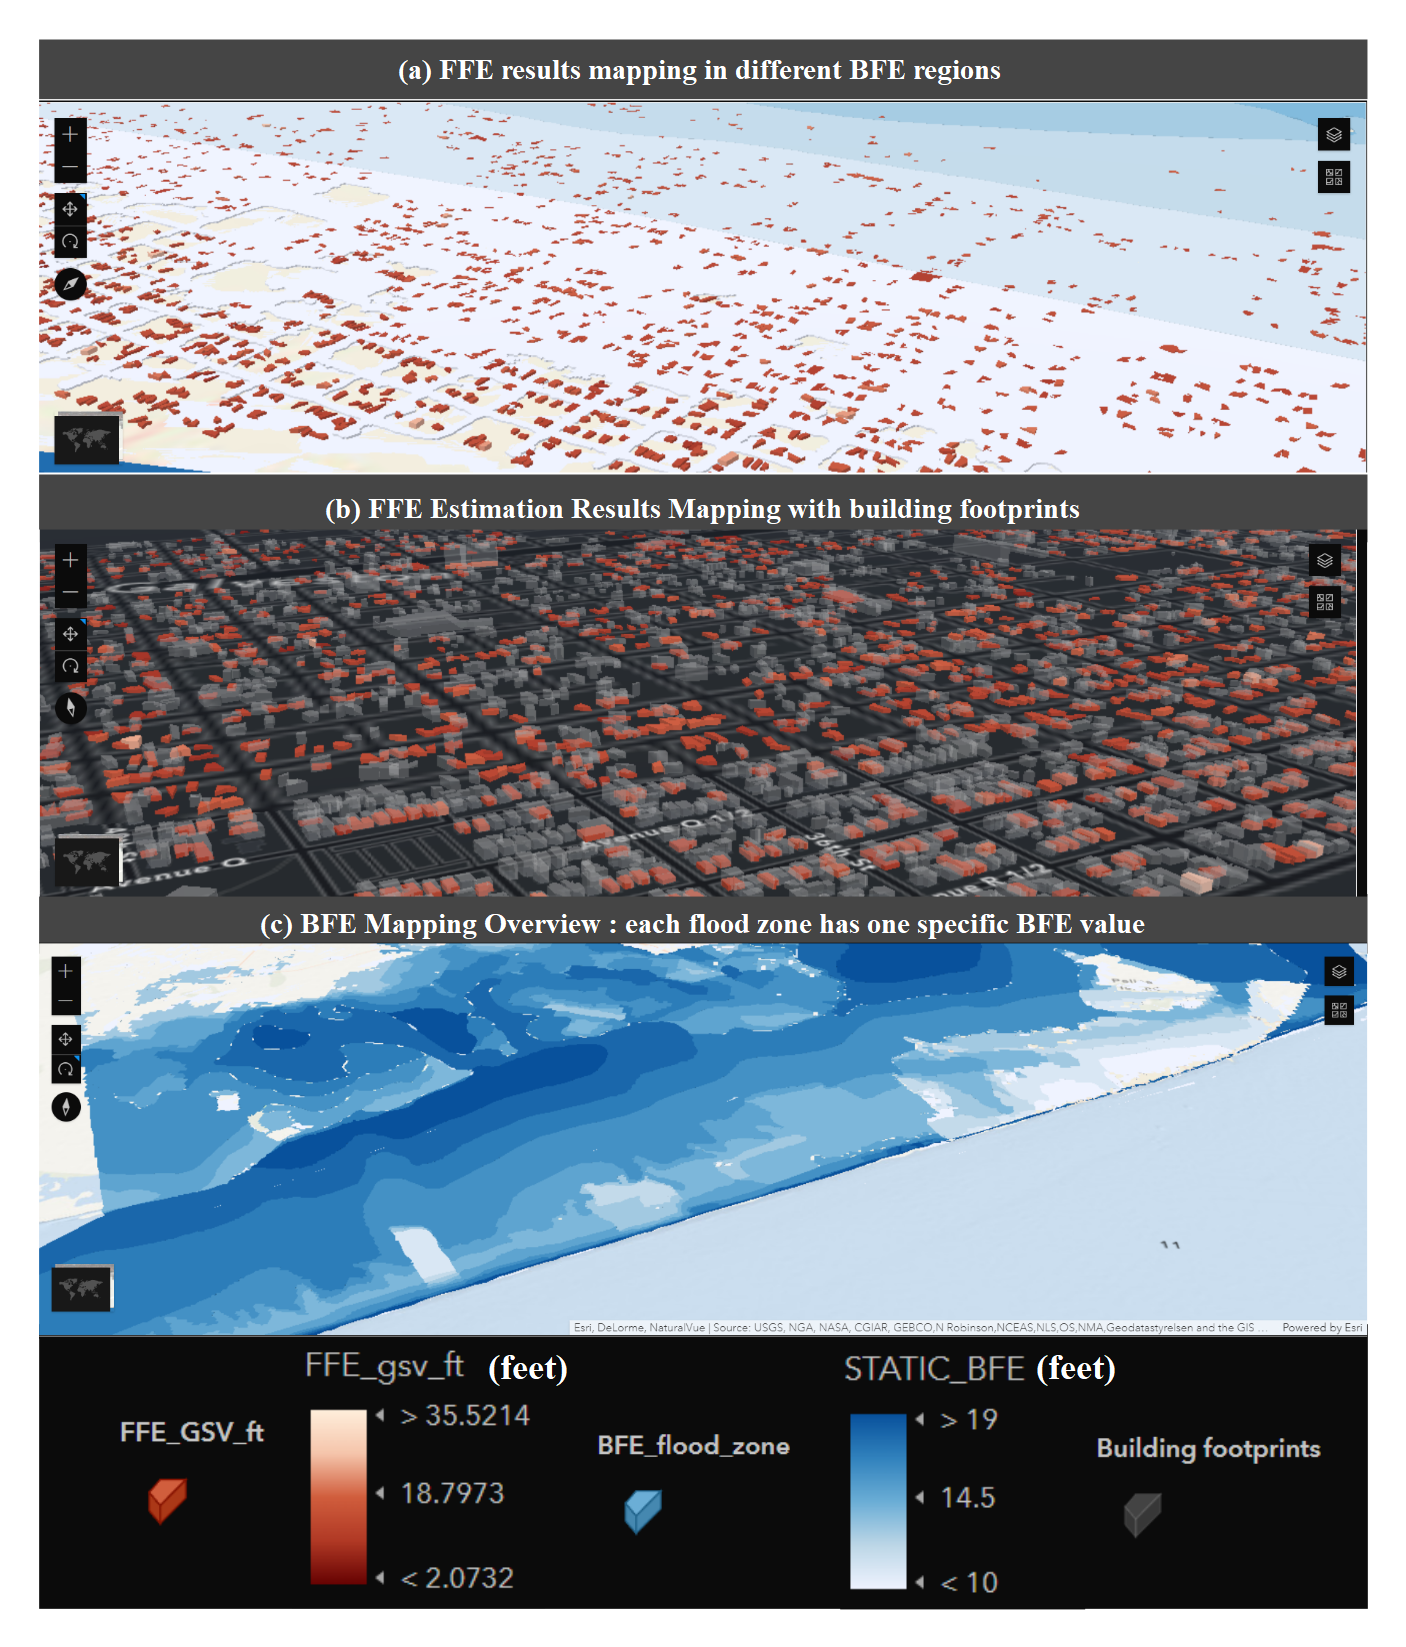
Fig. 2. Dashboard of the detected FFE results within BFE mapping
(https://experience.arcgis.com/experience/30837ddf6000410a8533140f82ee395c ).
*Section G: Procedure of Calculating the FFE of All Buildings in Galveston Island and Overview of Detected FFE results within BFE mapping*
The improved YOLO-v5 module detected 29,534 images with door frames from all 130,272 GSV images (due to the large amount of data, we did not perform a manual post-check on the valid images). Then, we downloaded a total of 16,464 depthmaps and panoramas based on the valid images and combined the data with the DEM of coastal Texas to obtain the road elevation, , and the camera height, . In the calculation, we obtained the FFE of the front doors of 13,465 buildings in Galveston.
Following the removal of unreliable results derived from the outdated GSVs (i.e., those updated before 2014) and wrong detection cases (i.e., those where windows, garages, or partial outlines of fences, etc., were mistakenly detected as doors), 8,897 effective results remained. The detected FFEs are mapped to various BFE regions to gain greater insight; the overview of the data is depicted in Figure S5.
It is worth noting that many of the zones for which BFE data is empty in the FFE distribution map correspond to areas with 0.2% annual chance of flooding (white-colored land areas in Figure S5); also known as the 500-year floodplain, these areas have an annual flood risk below the 1% threshold that FEMA has set for establishing BFE values.
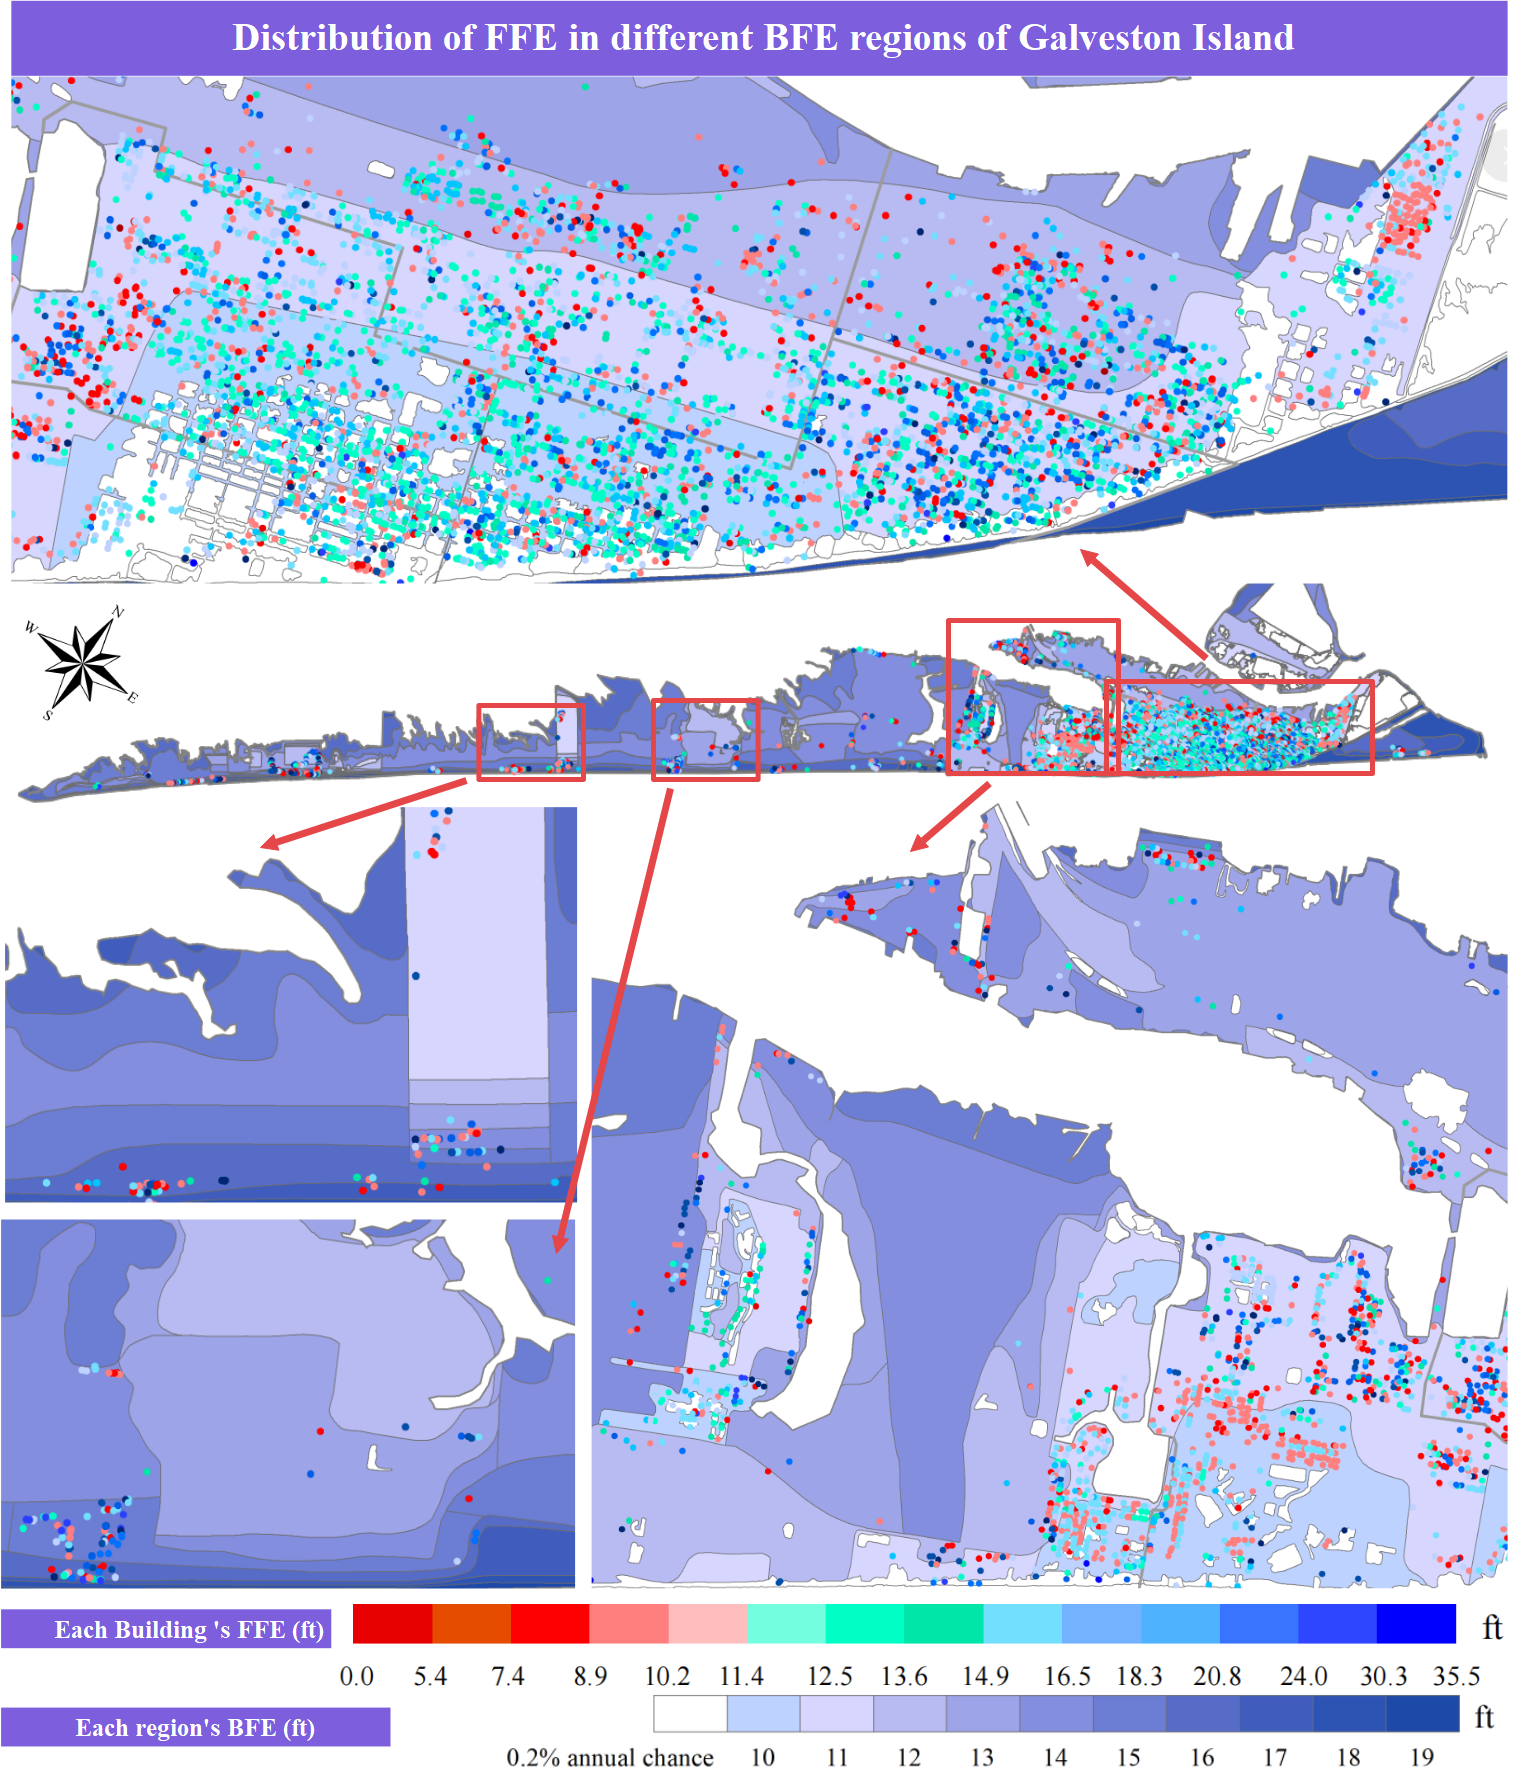
Fig. S5. The distribution of FFEs in different BFE regions of Galveston Island (0.2% annual chance flood zone has no BFE data)

Fig. S6. The distribution of building-scale elevation cost of residential houses in different BFE regions of Galveston Island (0.2% annual chance flood zone has no BFE data)
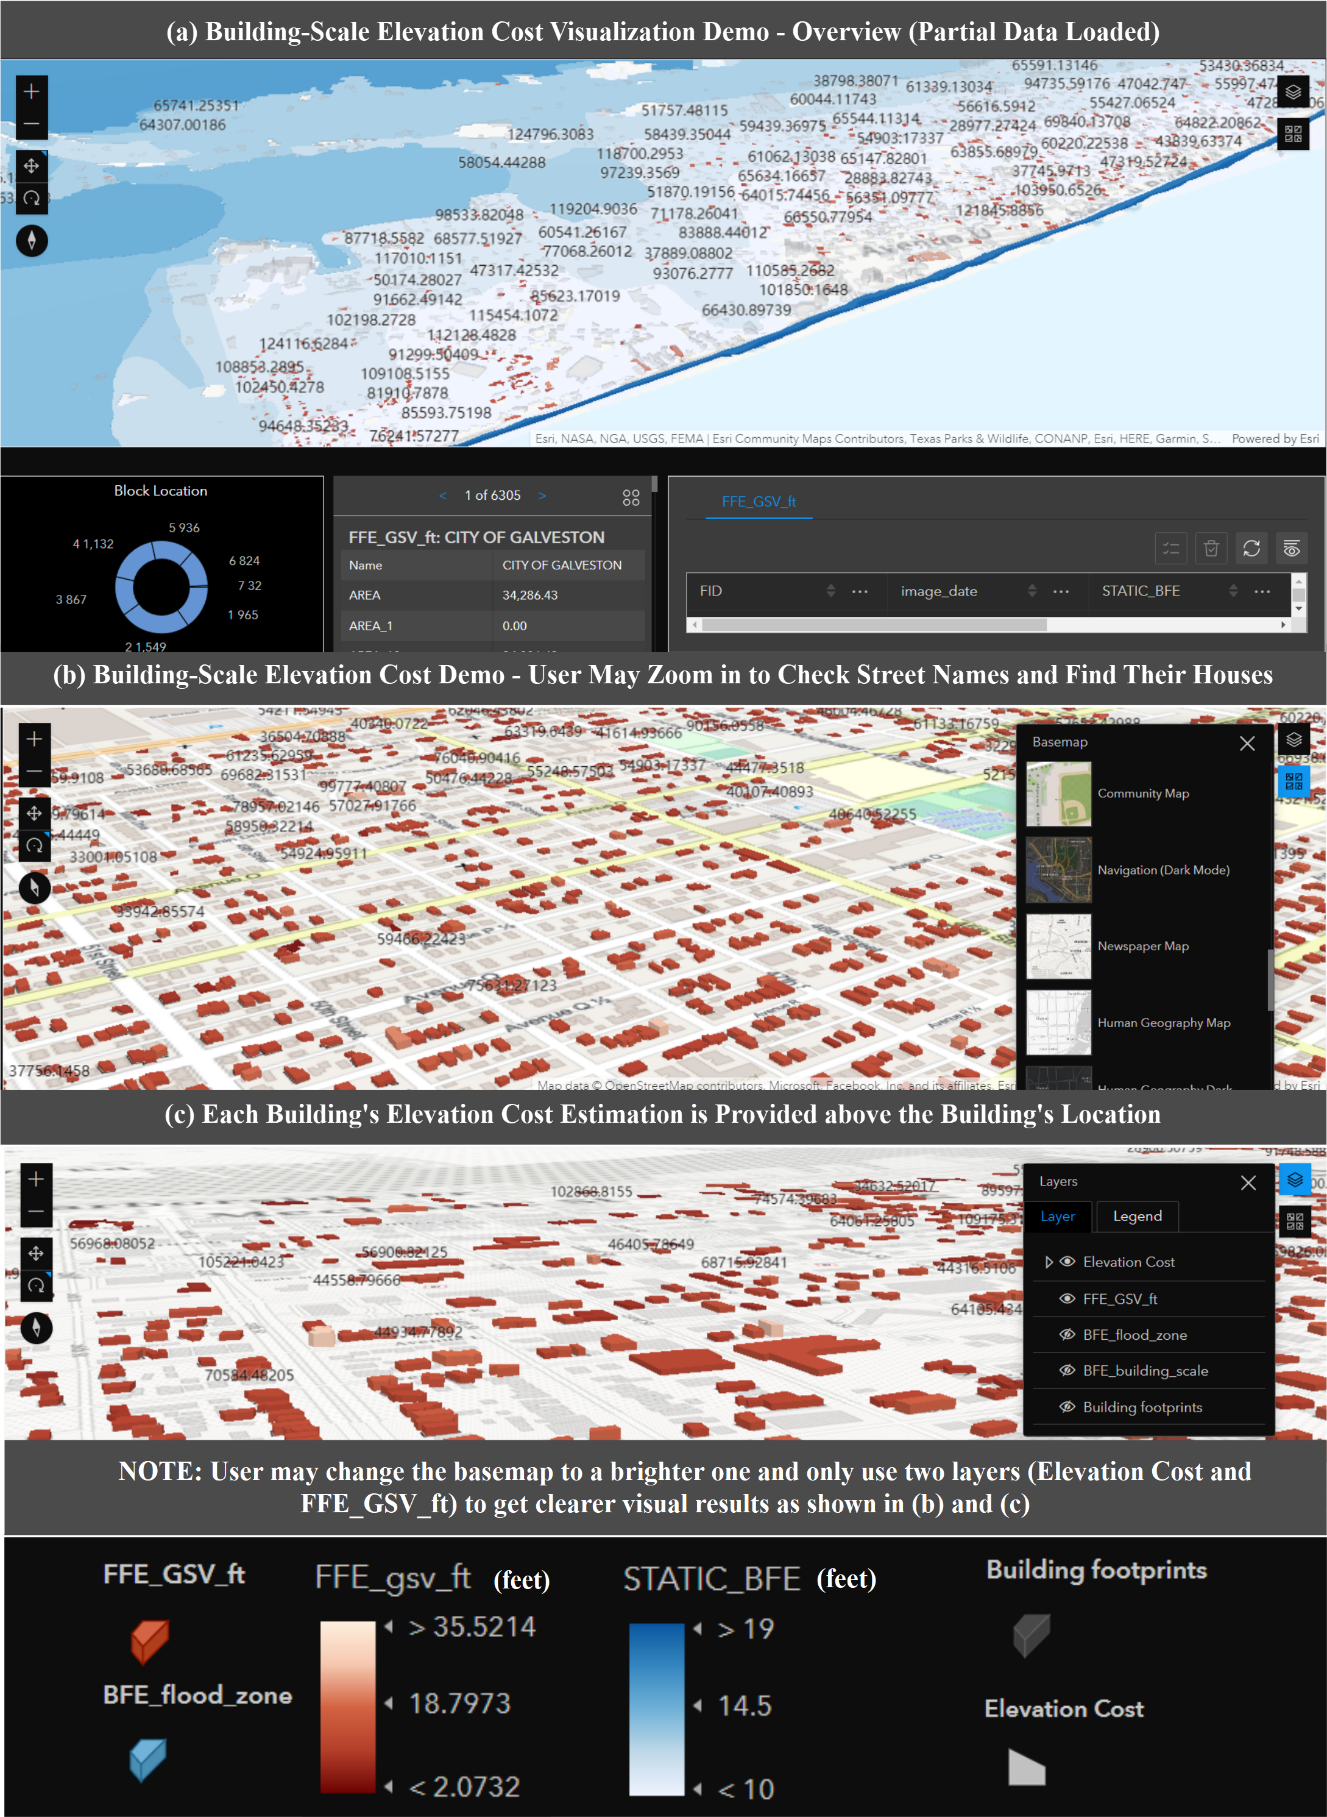
Fig. S9. Building-Scale Elevation Cost Visualization Demo ( https://experience.arcgis.com/experience/30837ddf6000410a8533140f82ee395c ).
This would allow residents who require elevation services to lift their houses with government guarantees of quality and greatly reduce the time they spend in the decision-making process (including collecting relevant information, judging whether it is necessary to raise the house, and estimating whether it can be afforded, etc.), which will increase the elevation rate of the target area and thereby eliminate safety concerns for more residents in areas with higher risk of disaster.